Export Pixie data in the OpenTelemetry format.Learn more🚀
Pixie has an OpenTelemetry plugin!
Ctrl/Cmd + K
Debugging with eBPF Part 2: Tracing full body HTTP request/responses

Zain Asgar
October 28, 2020 • 7 minutes readGVP/GM @ New Relic, Co-Founder/CEO of Pixie Labs
This is the second in a series of posts in which we share how you can use eBPF to debug applications without recompilation / redeployment. The first post provided a short introduction to eBPF and demonstrated how to use it to write a simple function argument tracer. In this second post, we will look at how to use eBPF to capture HTTP 1.X traffic.
Gaining visibility into HTTP traffic is valuable when working with distributed applications. This data can be used for performance, functional and security monitoring. Many applications accomplish this by utilizing middleware to add tracing or logging to HTTP requests in the application. One can also utilize popular open source frameworks like Open Telemetry to instrument requests and related context. In this post, we will take a look at an alternative approach that utilizes eBPF to capture HTTP data without having to manually add instrumentation. One advantage of this approach is that it always works, even if applications have not been specifically instrumented.
Part 1 of this series provides a more detailed overview of eBPF, which allows you to run restricted C code upon some trigger event. Kprobes provide a mechanism to trace the Kernel API or internals and uprobes provide a mechanism to intercept specific instructions in a user program. Since applications typically sit on top of the Kernel system API, if we capture the Kernel interface we should be able to capture all the ingress and egress data and reconstruct the HTTP requests.
Alternatively, we can use uprobes to carefully instrument underlying HTTP libraries (eg. net/http in Go) to capture HTTP requests directly. Since uprobes work at the application level, their implementation will be dependent on the underlying language used.
This post will explore tracing HTTP requests using both kprobes and uprobes and compare the tradeoffs for each.
What happens during an HTTP request?
Before we start writing any BPF code, let’s try to understand how HTTP requests are handled by the system. We will utilize the same test application we used in Part 1, a simple Golang HTTP server (simpleHTTP), however the results are generalizable to other HTTP applications. The first step is to understand what Linux kernel APIs are used to send and receive data for a simple HTTP request.
We can use the Linux perf command to understand what system calls are invoked:
sudo perf trace -p <PID>

Using curl, we’ll make a simple HTTP request in another terminal window:
curl http://localhost:9090/e\?iters\=10
Back in the original terminal window, where the perf command is running, you should see a spew of data:
[0] % sudo perf trace -p 1011089? ( ): app/1011089 ... [continued]: epoll_pwait()) = 1...0.087 ( 0.004 ms): app/1011089 accept4(fd: 3<socket:[7062148]>, upeer_sockaddr: 0xc0000799c8, upeer_addrlen: 0xc0000799ac, flags: 526336) = -1 EAGAIN (Resource temporarily unavailable)0.196 ( 0.005 ms): app/1011089 read(fd: 4, buf: 0xc00010e000, count: 4096) = 880.238 ( 0.005 ms): app/1011089 futex(uaddr: 0xc000098148, op: WAKE|PRIVATE_FLAG, val: 1) = 10.278 ( 0.023 ms): app/1011089 write(fd: 4, buf: 0xc00010f000, count: 128) = 128...0.422 ( 0.002 ms): app/1011091 close(fd: 4) = 0...
Note that we took care not to have any additional print statements in our app.go simple Golang HTTP server to avoid creating extra system calls.
Examining the output of the perf call shows us that there are 3 relevant system calls: accept4, write, close. Tracing these system calls should allow us to capture all of the data the server is sending out in response to a request.
From the server’s perspective, a typical request flow is shown below, where each box represents a system call. The Linux system call API is typically much more complex than this and there are other variants that can be used. For the purposes of this post we assume this simplified version, which works well for the application that we are tracing.
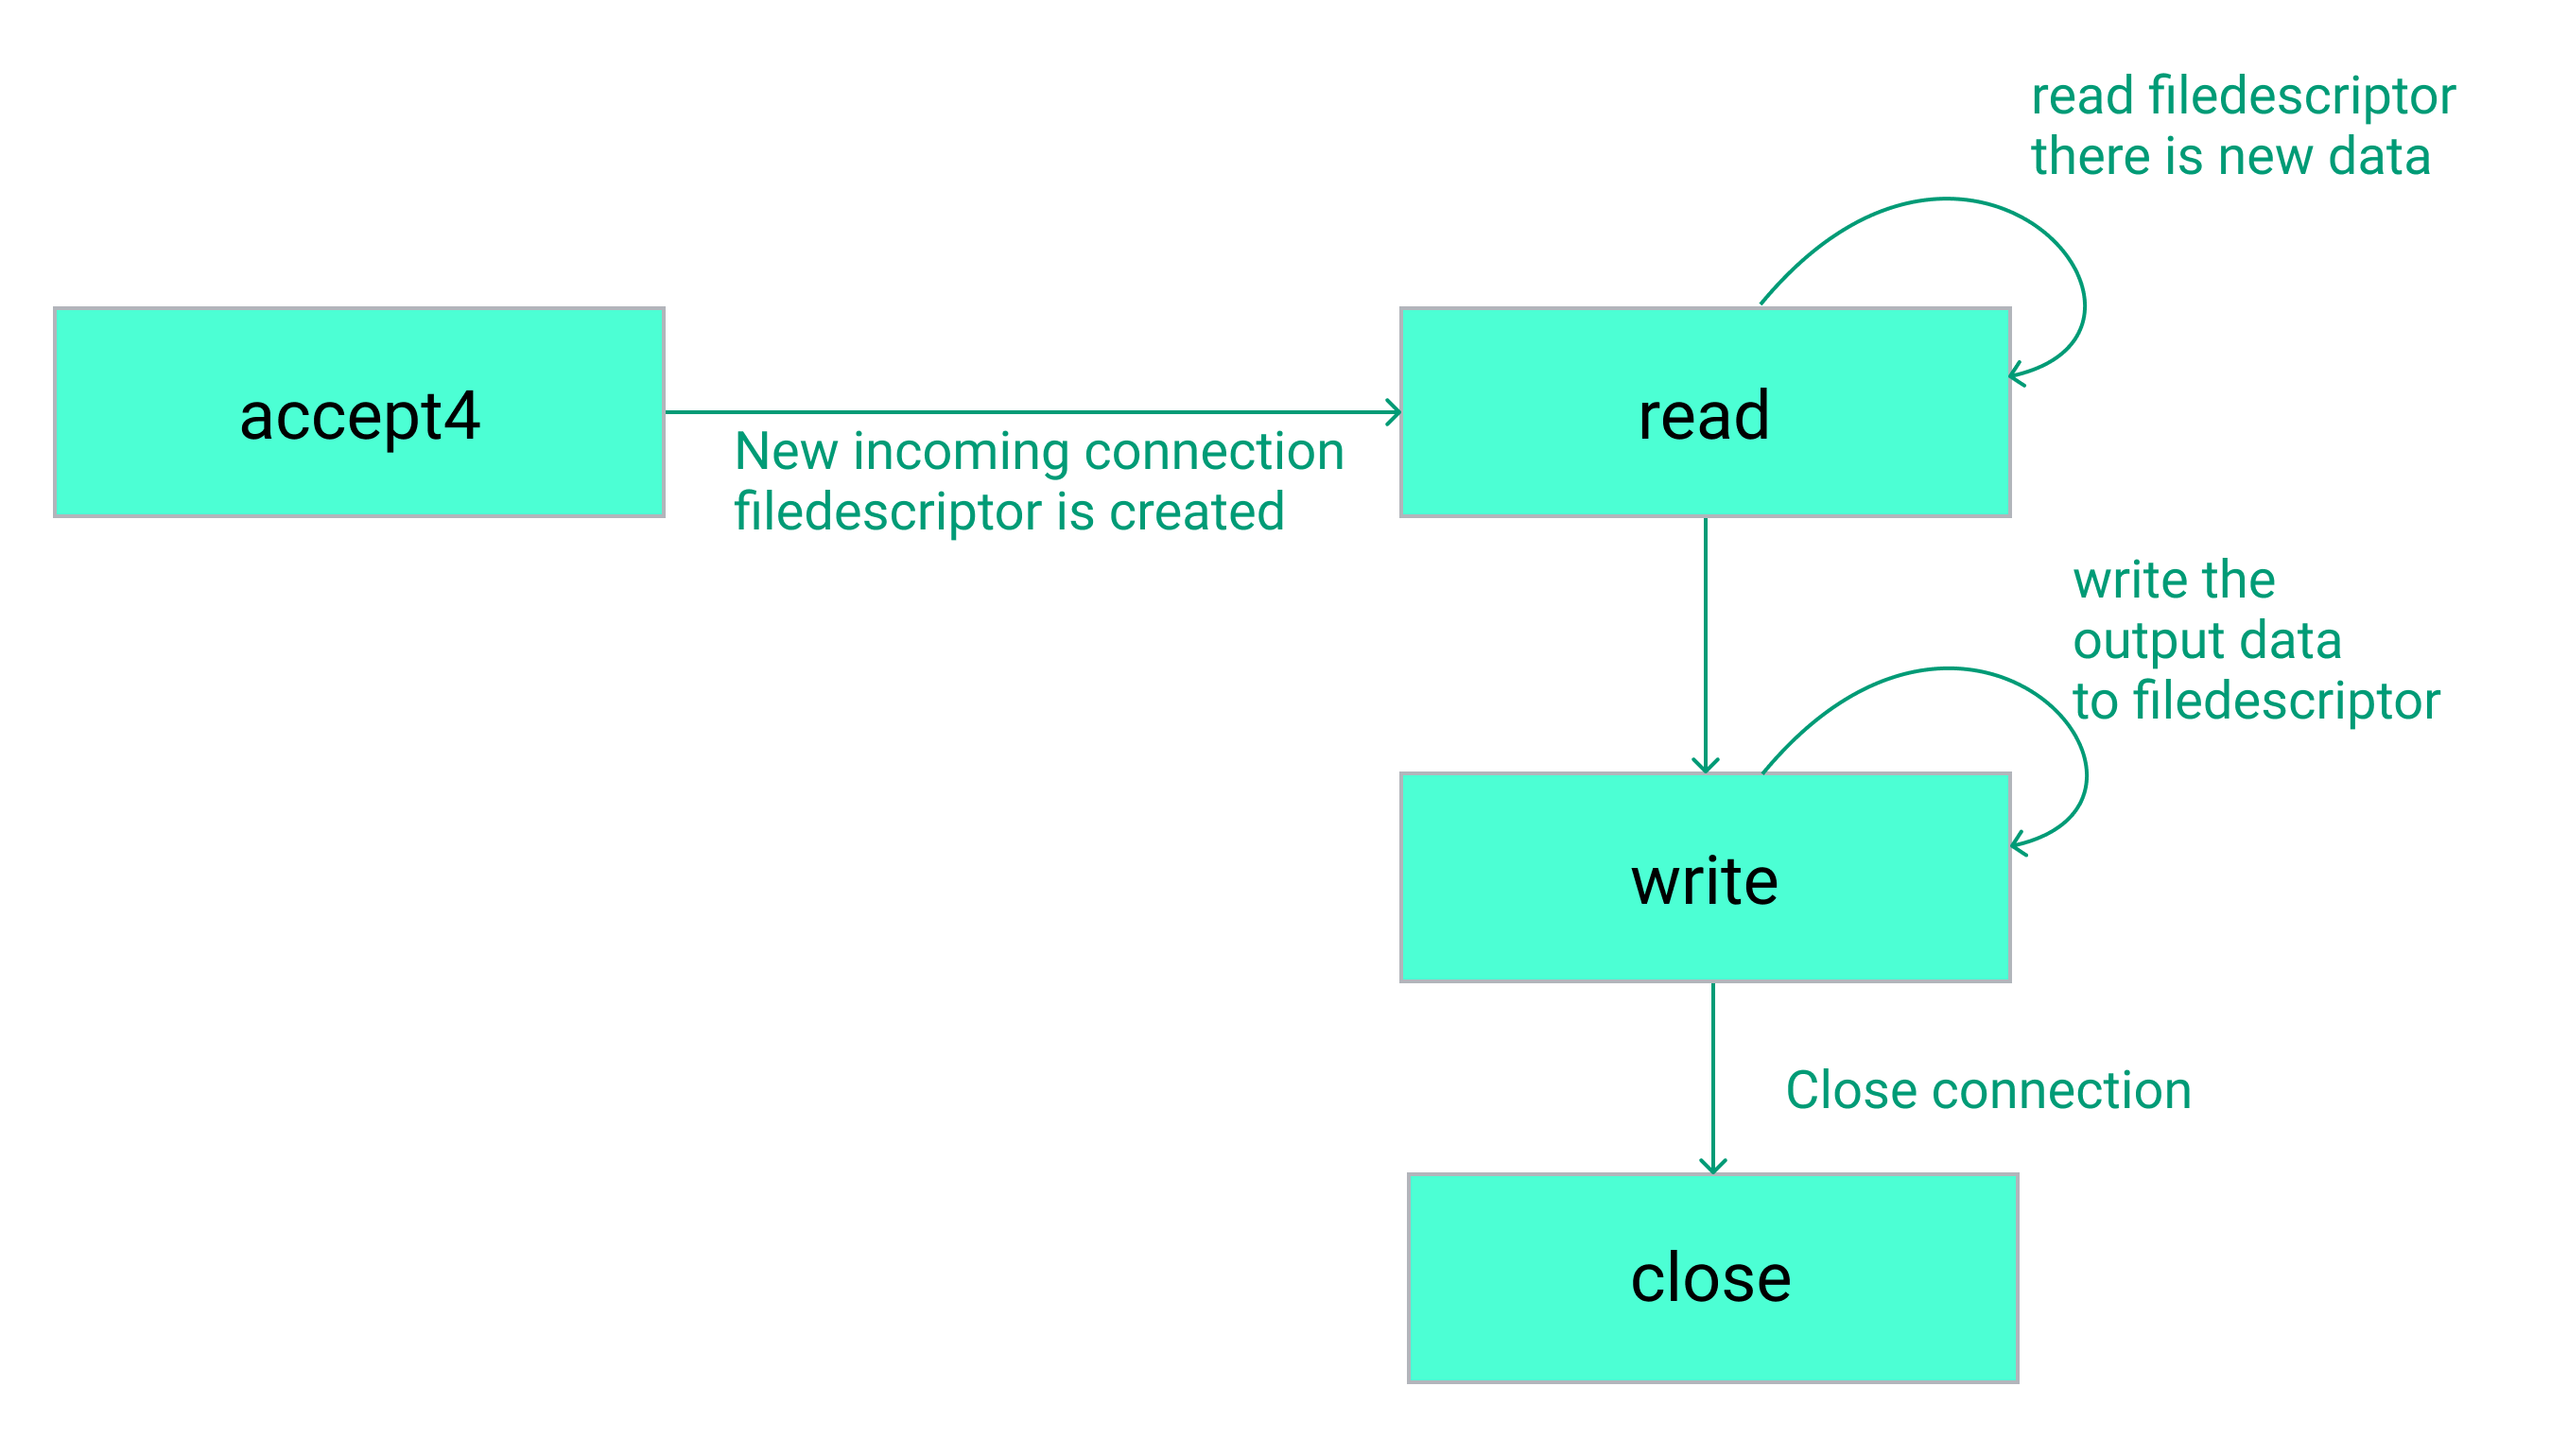
System call flow for an HTTP request.
While the focus of this example is on tracing the HTTP response, it is also possible to trace the data sent in the HTTP request by adding a probe to the read syscall.
Tracing with Kprobes
Now that we know that tracing accept4, write and close are sufficient for this binary, we can start constructing the BPF source code. Our program will roughly look like the following:
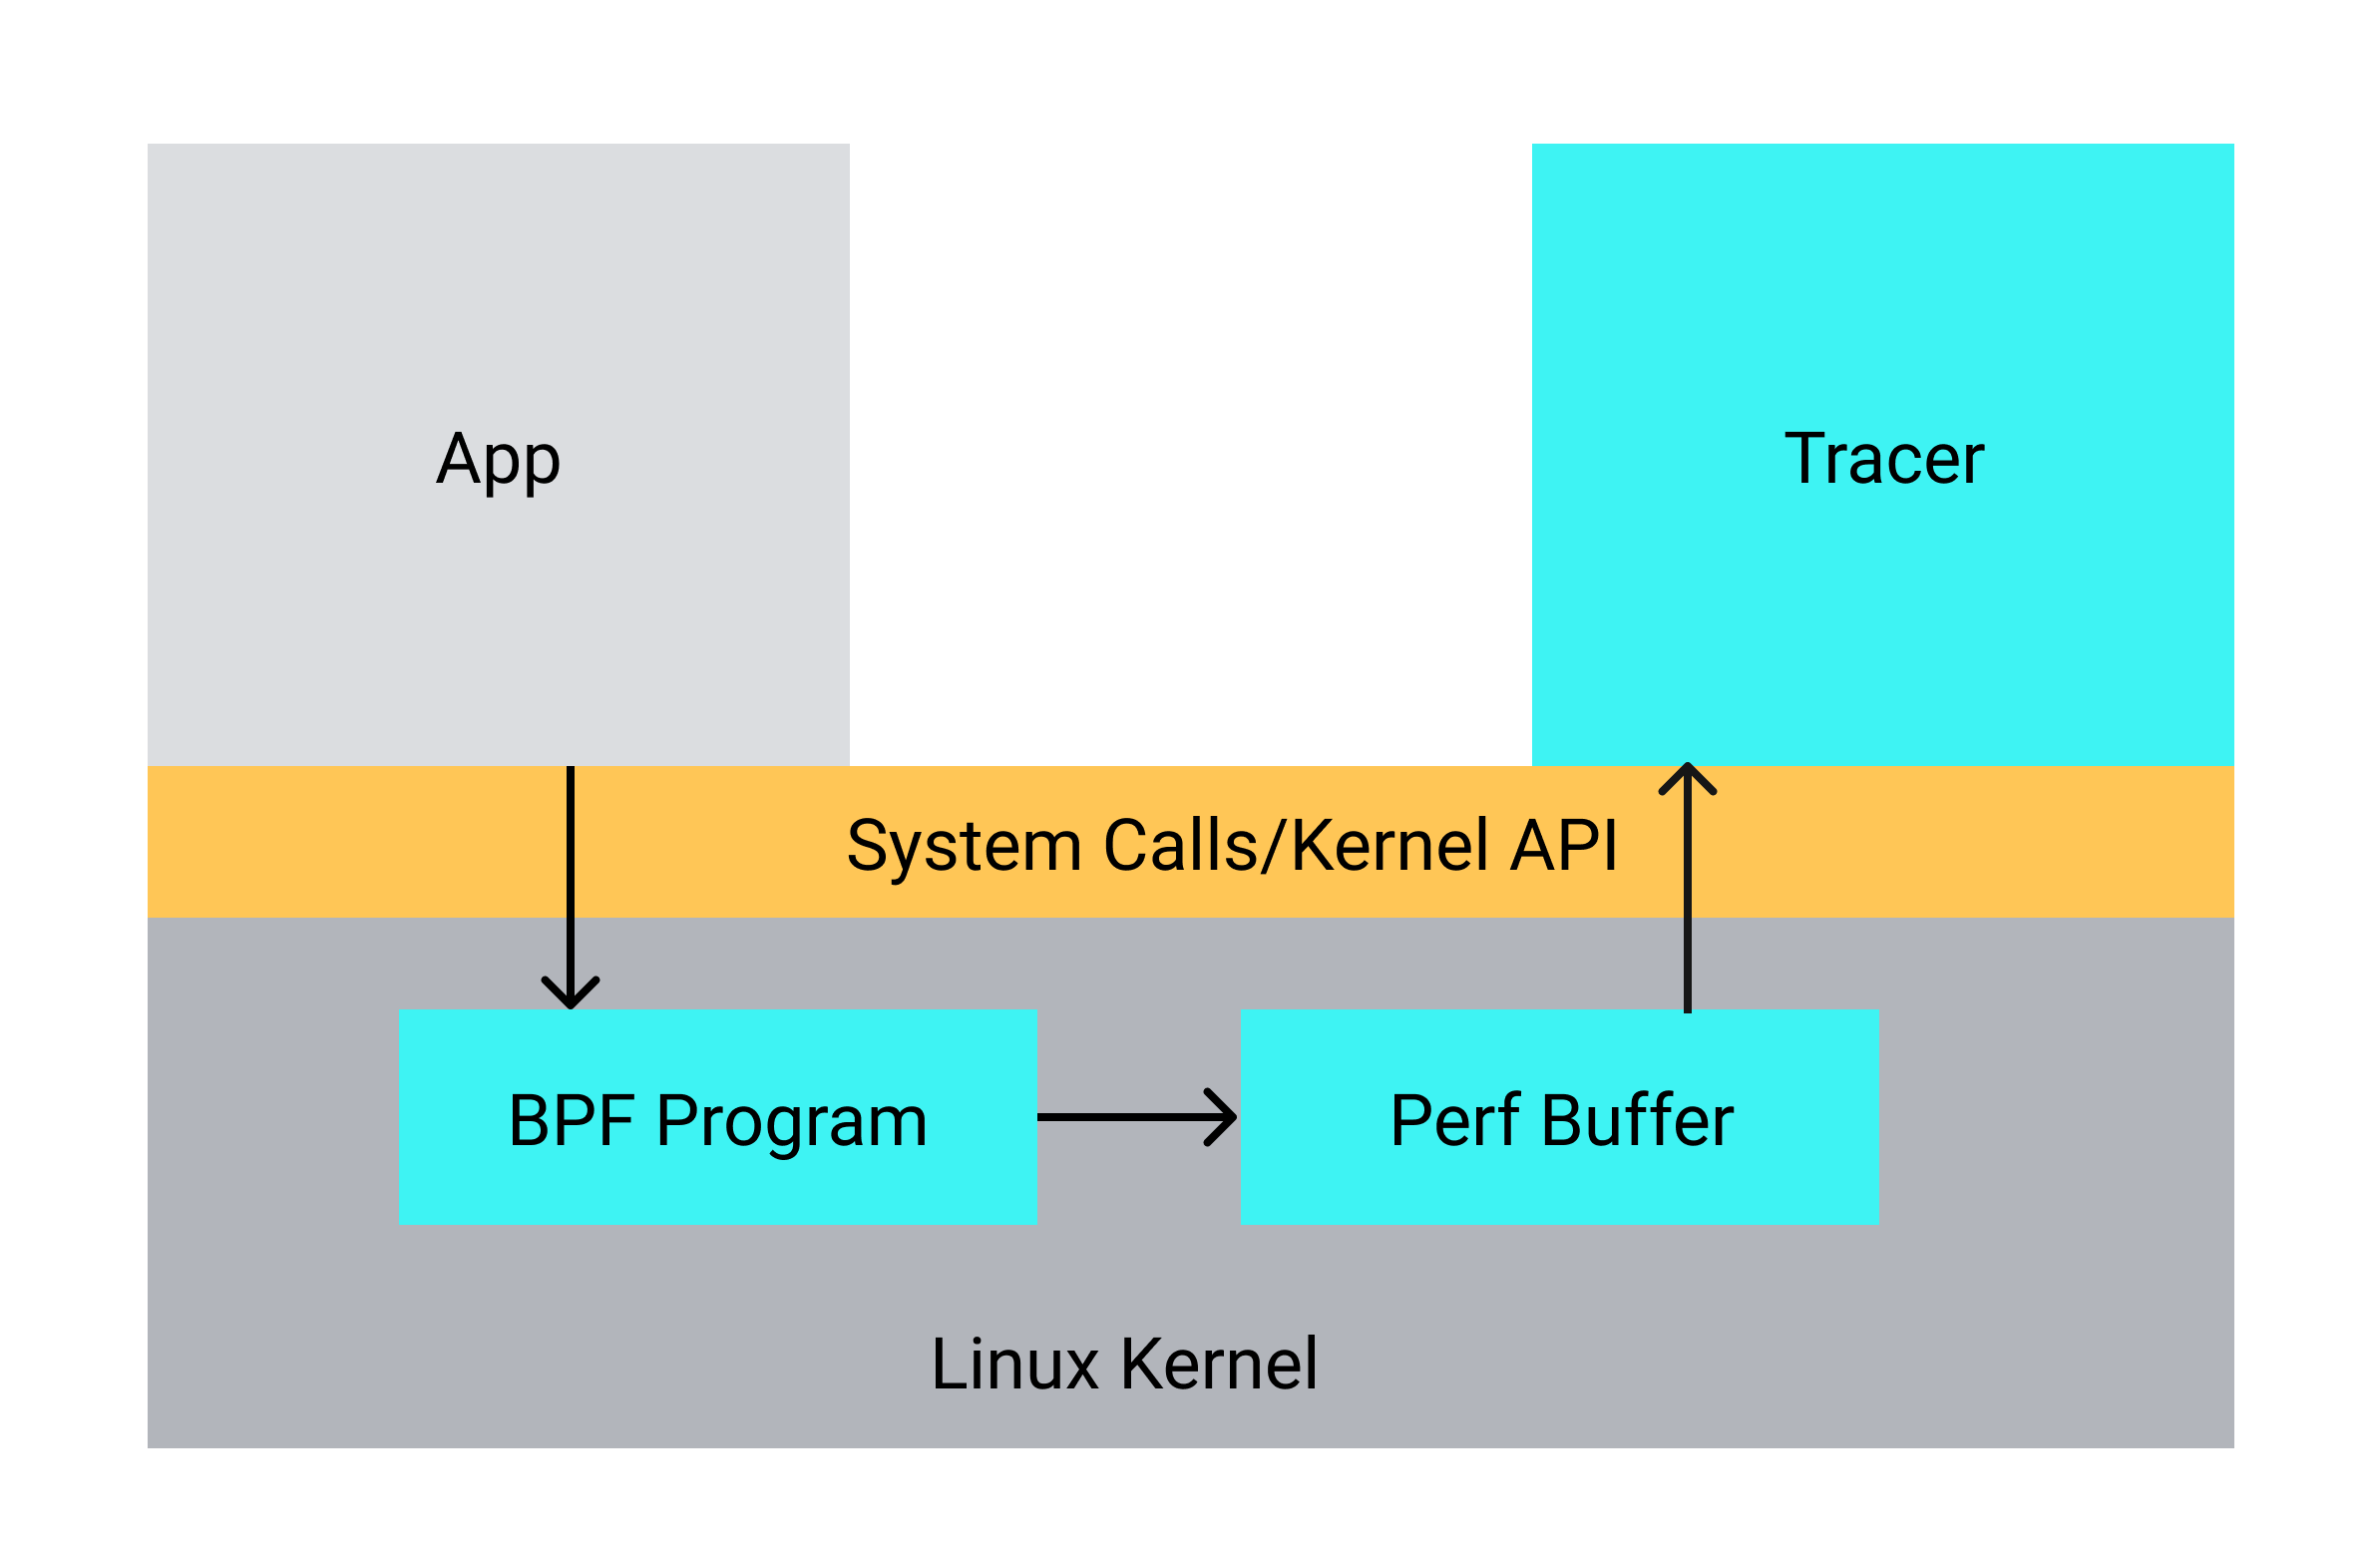
Diagram of our eBPF HTTP tracer using kprobes.
There is some additional complexity in the implementation in order to avoid limitations in eBPF (stacksize, etc.), but at a high level, we need to capture the following using 4 separate probes:
- Entry to
accept4: The entry contains information about the socket. We store this socket information - Return from
accept4: The return value for accept4 is the file descriptor. We store this file descriptor in a BPF_MAP. - Entry to
write: The write function gives us information about the file descriptor and the data written to that file descriptor. We write out this data to a perf buffer so the userspace tracing program can read it. - Entry to
close: We use the file descriptor information to clear the BPF_MAP we allocated above and stop tracking this fd.
Note that kprobes work across the entire system so we need to filter by PID to limit capturing the data to only the processes of interest. This is done for all the probes listed above.
Once the data is captured, we can read it to our Go userspace program and parse the HTTP response using the net/http library.
The kprobe approach is conceptually simple, but the implementation is fairly long. You can check out the detailed code here. For brevity, we left out a few details such as reading the return value from write to know how many bytes were actually written.
One downside to capturing data using kprobes is that we land up reparsing all responses since we intercept them after they have been converted to the write format. An alternative approach is to use uprobes to capture the data before it gets sent to the kernel where we can read the data before it has been serialized.
Tracing with Uprobes
Uprobes can be used to interrupt the execution of the program at a particular address and allow a BPF program to collect the underlying data. This capability can be used to capture data in a client library, but the underlying BPF code and addresses/offsets of interest will be dependent on the library's implementation . As a result, if there are changes in the client library, the uprobe will need to be updated as well. Therefore, it is best to add uprobes for client libraries that are unlikely to change significantly in order to minimize the number of updates we make to our uprobes.
For Go, we will try to find a tracepoint on the underlying net/http library. One approach is to directly examine the code to determine where to probe. We will show an alternate method that can be used to figure out which parts are relevant. For this, let’s run our application under delve:
1[0] % dlv exec ./app2Type 'help' for list of commands.3(dlv) c4Starting server on: :90905(dlv) break syscall.write6Breakpoint 1 set at 0x497083 for syscall.write() /opt/golang/src/syscall/zsyscall_linux_amd64.go:998
As discussed earlier, the write syscall is utilized by the operating system in order to send a HTTP response. We therefore set a breakpoint there so that we can identify the underlying client code that triggers the syscall to 'write'. When we run the curl command again the program should interrupt. We get the backtrace using bt:
1(dlv) bt2 0x0000000000497083 in syscall.write at /opt/golang/src/syscall/zsyscall_linux_amd64.go:9983 0x00000000004aa481 in syscall.Write at /opt/golang/src/syscall/syscall_unix.go:2024 0x00000000004aa481 in internal/poll.(*FD).Write at /opt/golang/src/internal/poll/fd_unix.go:2685 0x0000000000545c4f in net.(*netFD).Write at /opt/golang/src/net/fd_unix.go:2206 0x0000000000551ef8 in net.(*conn).Write at /opt/golang/src/net/net.go:1967 0x0000000000638e36 in net/http.checkConnErrorWriter.Write at /opt/golang/src/net/http/server.go:34198 0x00000000005116c5 in bufio.(*Writer).Flush at /opt/golang/src/bufio/bufio.go:5939 0x0000000000632c61 in net/http.(*response).finishRequest at /opt/golang/src/net/http/server.go:158810 0x0000000000633bd3 in net/http.(*conn).serve at /opt/golang/src/net/http/server.go:189511 0x000000000045afe1 in runtime.goexit at /opt/golang/src/runtime/asm_amd64.s:1357
Examining the stack, we find that the net/http.(*response).finishRequest function on line 9 looks promising. The Go source code tells us that this function is invoked every time an HTTP request is completed. This function is a good spot to grab the data with uprobes for a particular request.
The capture of the data is a direct extension of our approach in Part 1. We employ the same strategy to read variables in the struct, except this time we need to chase a few pointers. The BPF code for this is documented and located here, along with the user space code required to read the recorded data.
In order to compare our two different approaches, we must consider
- Which probe is easier to design and implement?
- Which probe is more performant?
- Which probe is easier to maintain?
To answer the first question, let’s look at the pros and cons of each approach.
| Pros | Cons | |
|---|---|---|
| kprobe |
|
|
| uprobe |
|
|
Conceptually, Kprobes are the clear winner since we can avoid any language dependence to perform HTTP capture. However, this method has the added caveat that we need to reparse every response, so we should investigate whether that introduces a significant performance overhead. It is worth calling out that kprobes do not work with TLS. However, we will share our method for tracing TLS requests using eBPF in a future blog post.
Benchmarking performance of uprobes vs. kprobes
Since these probes will be used to monitor applications in production, we want them to have minimal overhead. On a fully loaded system, we want to understand the impact of deploying our tracers. One metric we can use to understand the performance impact is to look at the impact on the observed latency and the ability to handle high request throughput. This is not a comprehensive test and we will utilize our simple app binary to perform it. Since the probes only add overhead when the actual HTTP request is made, rather than when the request is processed, our simple binary nearly simulates the worst-case scenario.
Our experimental setup looks like:
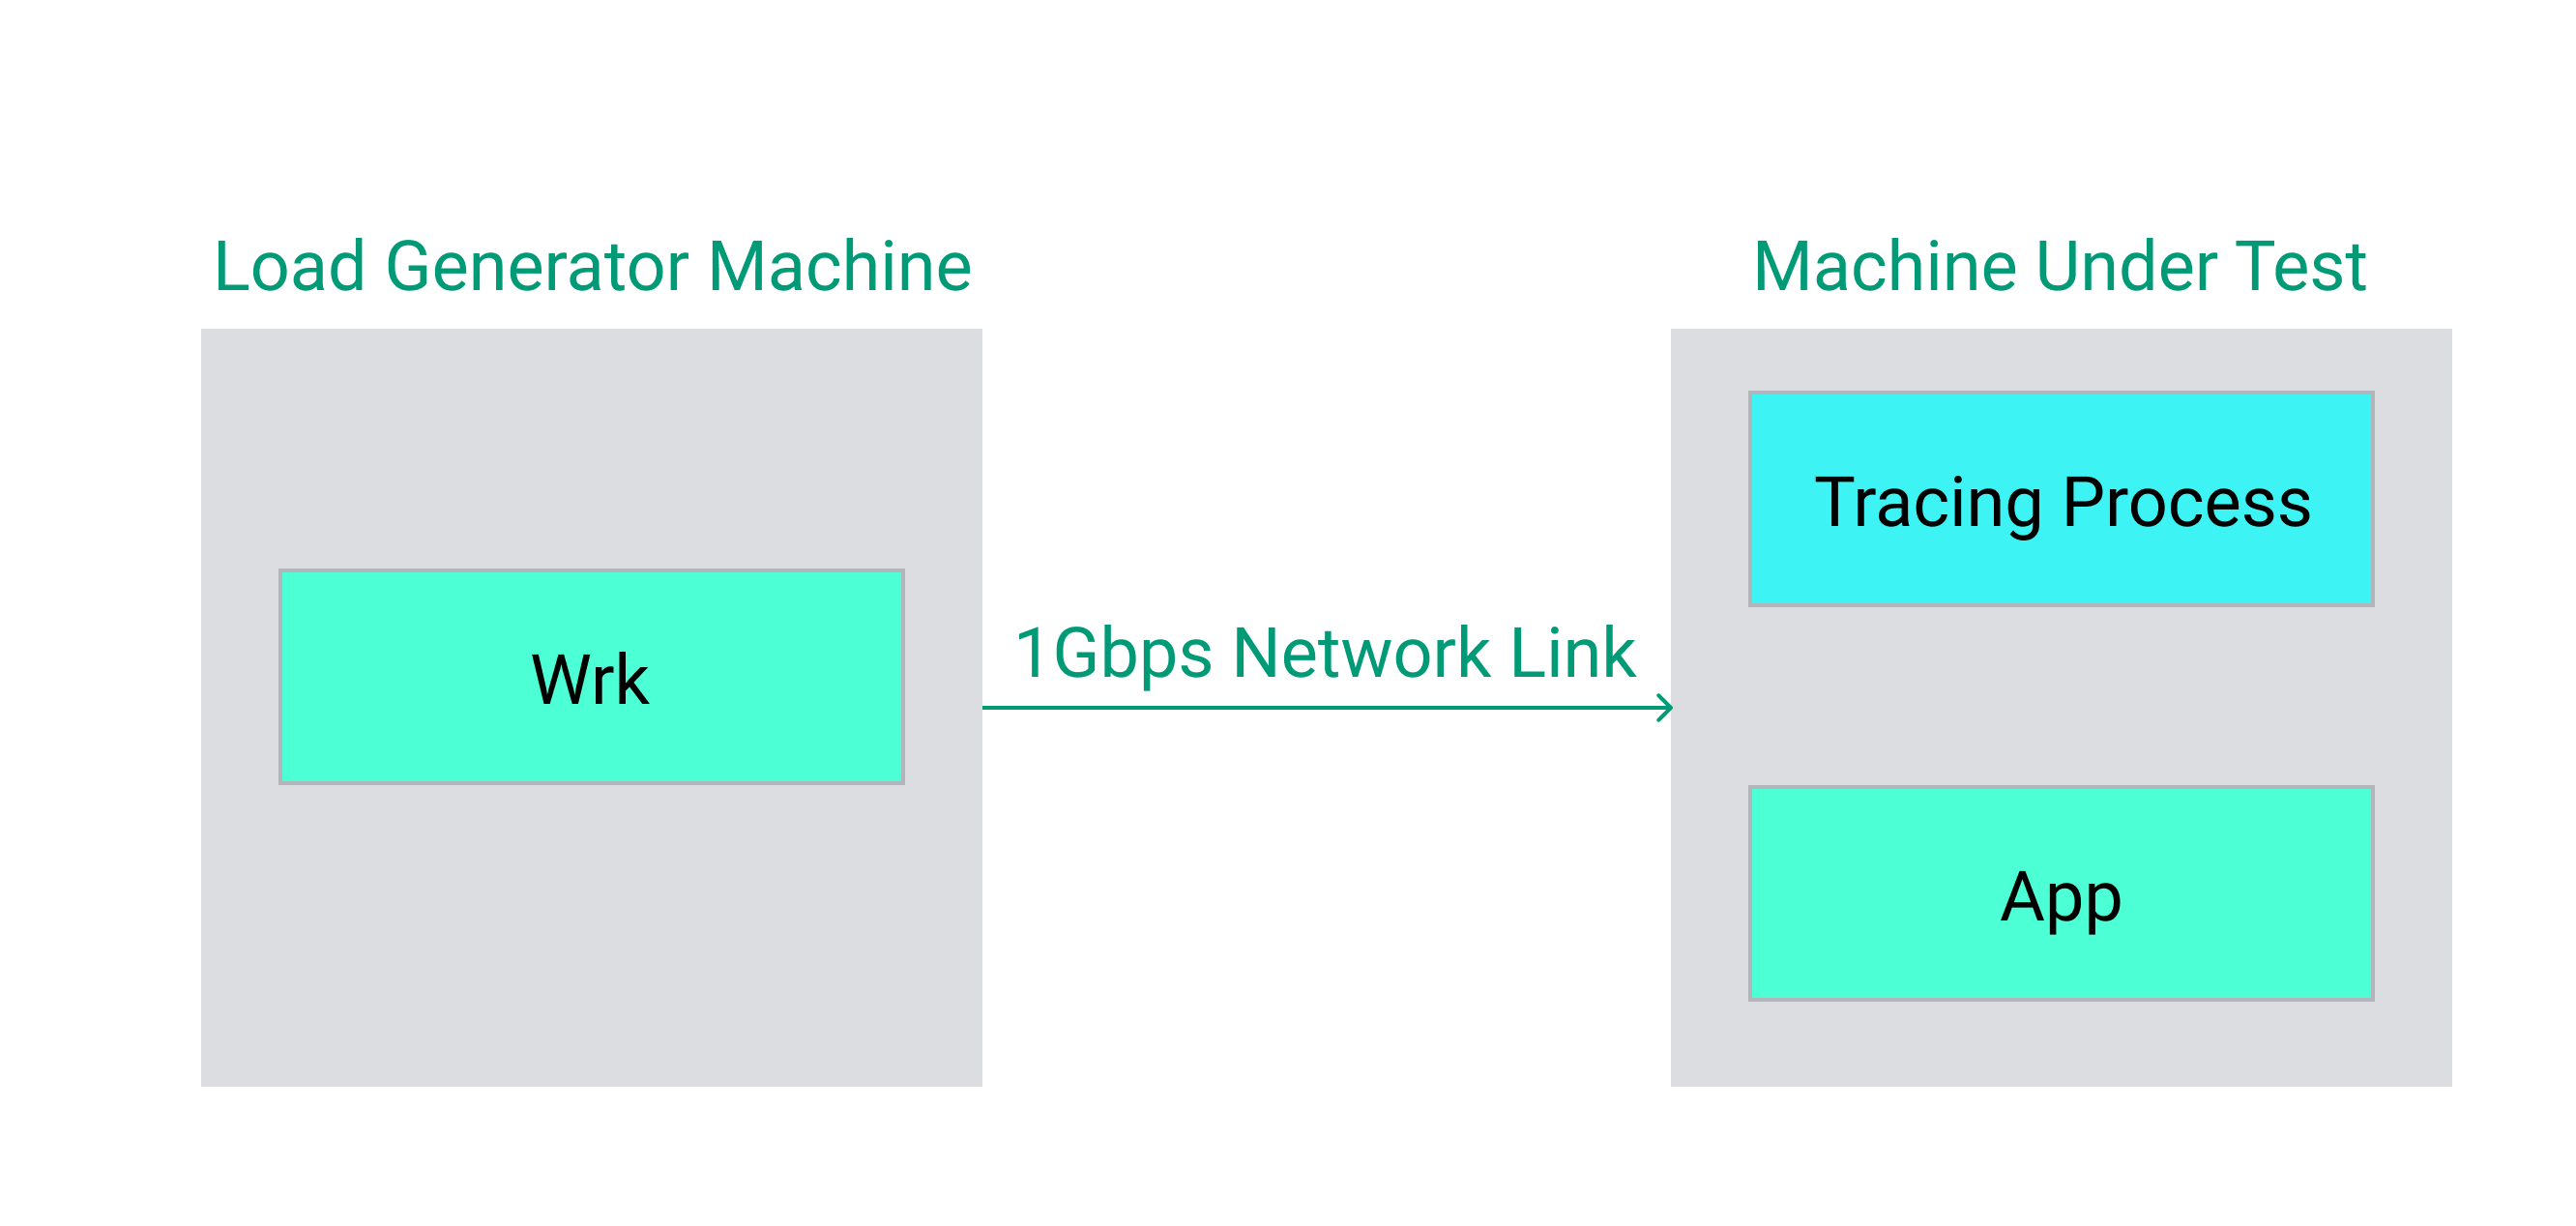
Benchmark setup for comparing kprobes vs uprobes.
We utilize a modern Intel core-i9 machine with 14 physical cores to host both the load generator and the machine under test hosting the application and tracer. When running requests, we took care to ensure that the machine was under sufficient load to saturate the CPUs on the machine.
We captured HTTP requests of various durations by increasing the iterations parameter of the computeE function on our app.go http server. This is a relatively CPU-heavy workload because each invocation of the HTTP endpoint causes a loop to run a set number of iterations. The resulting overhead on request throughput and latency is plotted against the median latency of the baseline request, normalized by the baseline metric.
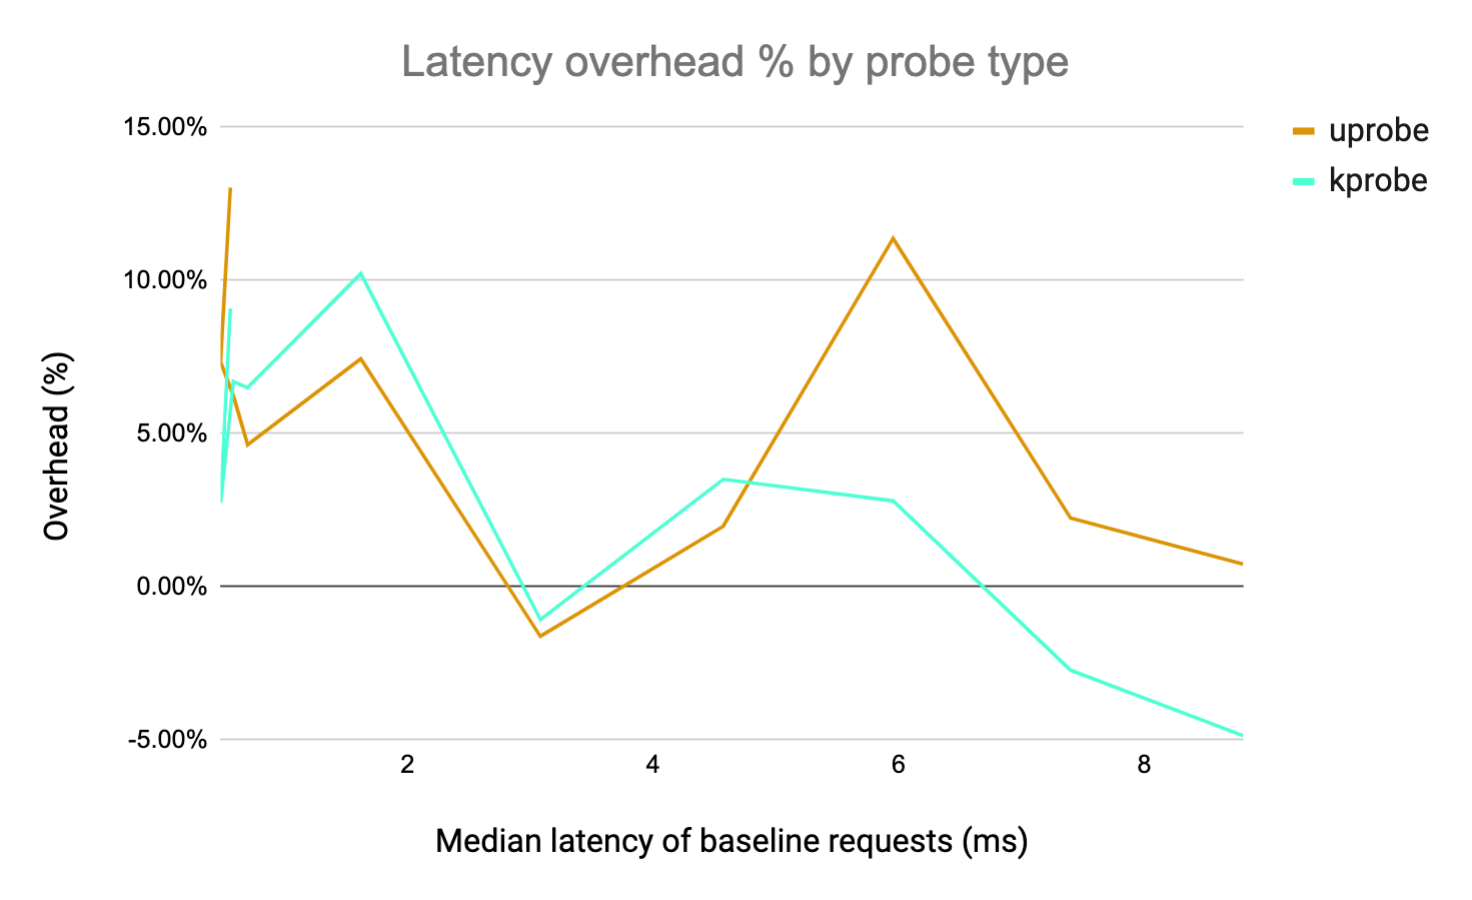
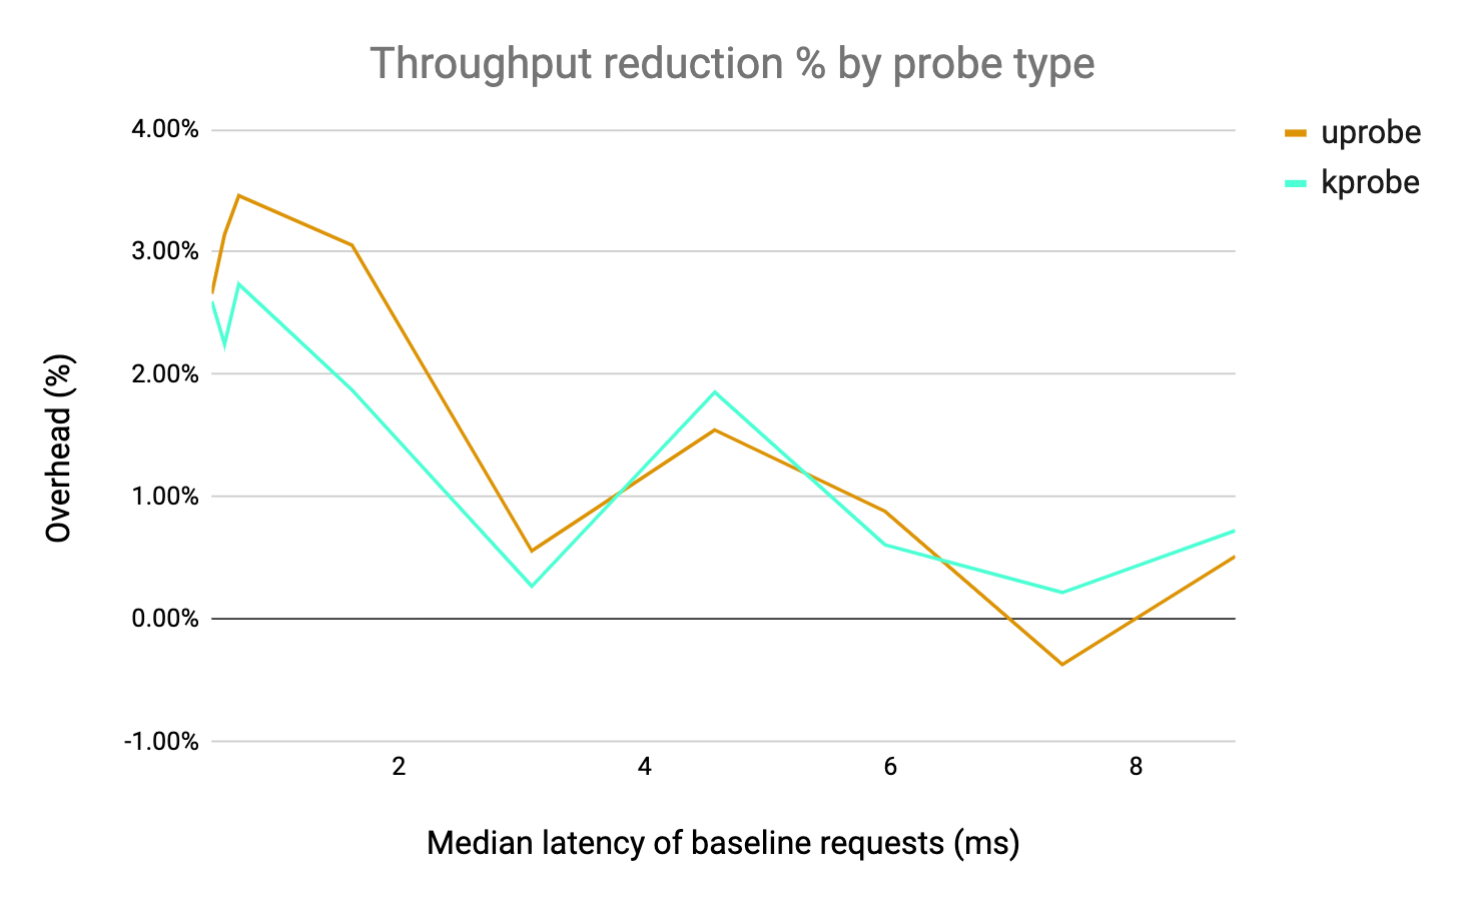
From the results, we can see that if the HTTP latency is > 1ms the overhead introduced is negligible and in most cases appears to be noise. This is similar for Kprobes and Uprobes, with Kprobes performing slightly better (even though we are reparsing all the data). Note that the overhead is occasionally negative -- this is most likely just noise in the measurement. The key takeaway here is that if your HTTP handler is doing any real work (about 1ms of compute) the overhead introduced is basically negligible.
Conclusion
Running the eBPF HTTP tracing demo code.
Tracing HTTP requests using eBPF is possible using both kprobes and uprobes; however, the kprobe approach is more scalable as it is agnostic to the target language. The code used in this blog is available here and should be fully functional to trace Go/Python applications. Making it robust and functional across the entire Kernel API surface can involve a significant amount of work. Some language stacks use different underlying syscalls such as writev, or excessively split requests over multiple system calls.
At Pixie, we are building an auto-telemetry system for Kubernetes that requires no manual instrumentation to get started. eBPF provides most of the magic behind our platform. Pixie uses both uprobes and kprobes to enable a lot of our functionality. We’ll be discussing more of this in our future blogs posts. If this post's contents are interesting, please give Pixie a try, or check out our open positions.
Links
- Learn more about the Pixie Community Beta.
- Check out our open positions.
Related posts


Terms of Service|Privacy Policy
We are a Cloud Native Computing Foundation sandbox project.

Pixie was originally created and contributed by New Relic, Inc.
Copyright © 2018 - The Pixie Authors. All Rights Reserved. | Content distributed under CC BY 4.0.
The Linux Foundation has registered trademarks and uses trademarks. For a list of trademarks of The Linux Foundation, please see our Trademark Usage Page.
Pixie was originally created and contributed by New Relic, Inc.
This site uses cookies to provide you with a better user experience. By using Pixie, you consent to our use of cookies.