This is the first in a series of posts describing how we can debug applications in production using eBPF, without recompilation/redeployment. This post describes how to use gobpf and uprobes to build a function argument tracer for Go applications. This technique is also extendable to other compiled languages such as C++, Rust, etc. The next sets of posts in this series will discuss using eBPF for tracing HTTP/gRPC data, SSL, etc.
When debugging, we are typically interested in capturing the state of a program. This allows us to examine what the application is doing and determine where the bug is located in our code. A simple way to observe state is to use a debugger to capture function arguments. For Go applications, we often use Delve or gdb.
Delve and gdb work well for debugging in a development environment, but they are not often used in production. The features that make these debuggers powerful can also make them undesirable to use in production systems. Debuggers can cause significant interruption to the program and even allow mutation of state which might lead to unexpected failures of production software.
To more cleanly capture function arguments, we will explore using enhanced BPF (eBPF), which is available in Linux 4.x+, and the higher level Go library gobpf.
Extended BPF (eBPF) is a kernel technology that is available in Linux 4.x+. You can think of it as a lightweight sandboxed VM that runs inside of the Linux kernel and can provide verified access to kernel memory.
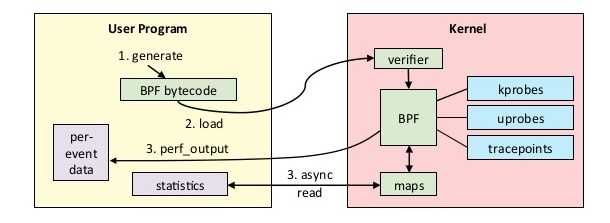
As shown in the overview below, eBPF allows the kernel to run BPF bytecode. While the front-end language used can vary, it is often a restricted subset of C. Typically the C code is first compiled to the BPF bytecode using Clang, then the bytecode is verified to make sure it's safe to execute. These strict verifications guarantee that the machine code will not intentionally or accidentally compromise the Linux kernel, and that the BPF probe will execute in a bounded number of instructions every time it is triggered. These guarantees enable eBPF to be used in performance-critical workloads like packet filtering, networking monitoring, etc.
Functionally, eBPF allows you to run restricted C code upon some event (eg. timer, network event or a function call). When triggered on a function call we call these functions probes and they can be used to either run on a function call within the kernel (kprobes), or a function call in a userspace program (uprobes). This post focuses on using uprobes to allow dynamic tracing of function arguments.
Uprobes allow you to intercept a userspace program by inserting a debug trap instruction (int3 on an x86) that triggers a soft-interrupt . This is also how debuggers work. The flow for an uprobe is essentially the same as any other BPF program and is summarized in the diagram below. The compiled and verified BPF program is executed as part of a uprobe, and the results can be written into a buffer.

Let's see how uprobes actually function. To deploy uprobes and capture function arguments, we will be using this simple demo application. The relevant parts of this Go program are shown below.
main() is a simple HTTP server that exposes a single GET endpoint on /e, which computes Euler's number (e) using an iterative approximation. computeE takes in a single query param(iters), which specifies the number of iterations to run for the approximation. The more iterations, the more accurate the approximation, at the cost of compute cycles. It's not essential to understand the math behind the function. We are just interested in tracing the arguments of any invocation of computeE.
1// computeE computes the approximation of e by running a fixed number of iterations.2func computeE(iterations int64) float64 {3 res := 2.04 fact := 1.056 for i := int64(2); i < iterations; i++ {7 fact *= float64(i)8 res += 1 / fact9 }10 return res11}1213func main() {14 http.HandleFunc("/e", func(w http.ResponseWriter, r *http.Request) {15 // Parse iters argument from get request, use default if not available.16 // ... removed for brevity ...17 w.Write([]byte(fmt.Sprintf("e = %0.4f\n", computeE(iters))))18 })19 // Start server...20}
To understand how uprobes work, let's look at how symbols are tracked inside binaries. Since uprobes work by inserting a debug trap instruction, we need to get the address where the function is located. Go binaries on Linux use ELF to store debug info. This information is available, even in optimized binaries, unless debug data has been stripped. We can use the command objdump to examine the symbols in the binary:
1[0] % objdump --syms app|grep computeE200000000006609a0 g F .text 000000000000004b main.computeE
From the output, we know that the function computeE is located at address 0x6609a0. To look at the instructions around it, we can ask objdump to disassemble to binary (done by adding -d). The disassembled code looks like:
1[0] % objdump -d app | less200000000006609a0 <main.computeE>:3 6609a0: 48 8b 44 24 08 mov 0x8(%rsp),%rax4 6609a5: b9 02 00 00 00 mov $0x2,%ecx5 6609aa: f2 0f 10 05 16 a6 0f movsd 0xfa616(%rip),%xmm06 6609b1: 007 6609b2: f2 0f 10 0d 36 a6 0f movsd 0xfa636(%rip),%xmm1
From this we can see what happens when computeE is called. The first instruction is mov 0x8(%rsp),%rax. This moves the content offset 0x8 from the rsp register to the rax register. This is actually the input argument iterations above; Go's arguments are passed on the stack.
With this information in mind, we are now ready to dive in and write code to trace the arguments for computeE.
To capture the events, we need to register a uprobe function and have a userspace function that can read the output. A diagram of this is shown below. We will write a binary called tracer that is responsible for registering the BPF code and reading the results of the BPF code. As shown, the uprobe will simply write to a perf-buffer, a linux kernel data structure used for perf events.
High-level overview showing the Tracer binary listening to perf events generated from the App
Now that we understand the pieces involved, let's look into the details of what happens when we add an uprobe. The diagram below shows how the binary is modified by the Linux kernel with an uprobe. The soft-interrupt instruction (int3) is inserted as the first instruction in main.computeE. This causes a soft-interrupt, allowing the Linux kernel to execute our BPF function. We then write the arguments to the perf-buffer, which is asynchronously read by the tracer.
Details of how a debug trap instruction is used call a BPF program
The BPF function for this is relatively simple; the C code is shown below. We register this function so that it's invoked every time main.computeE is called. Once it's called, we simply read the function argument and write that the perf buffer. Lots of boilerplate is required to set up the buffers, etc. and this can be found in the complete example here.
1#include <uapi/linux/ptrace.h>23BPF_PERF_OUTPUT(trace);45inline int computeECalled(struct pt_regs *ctx) {6 // The input argument is stored in ax.7 long val = ctx->ax;8 trace.perf_submit(ctx, &val, sizeof(val));9 return 0;10}
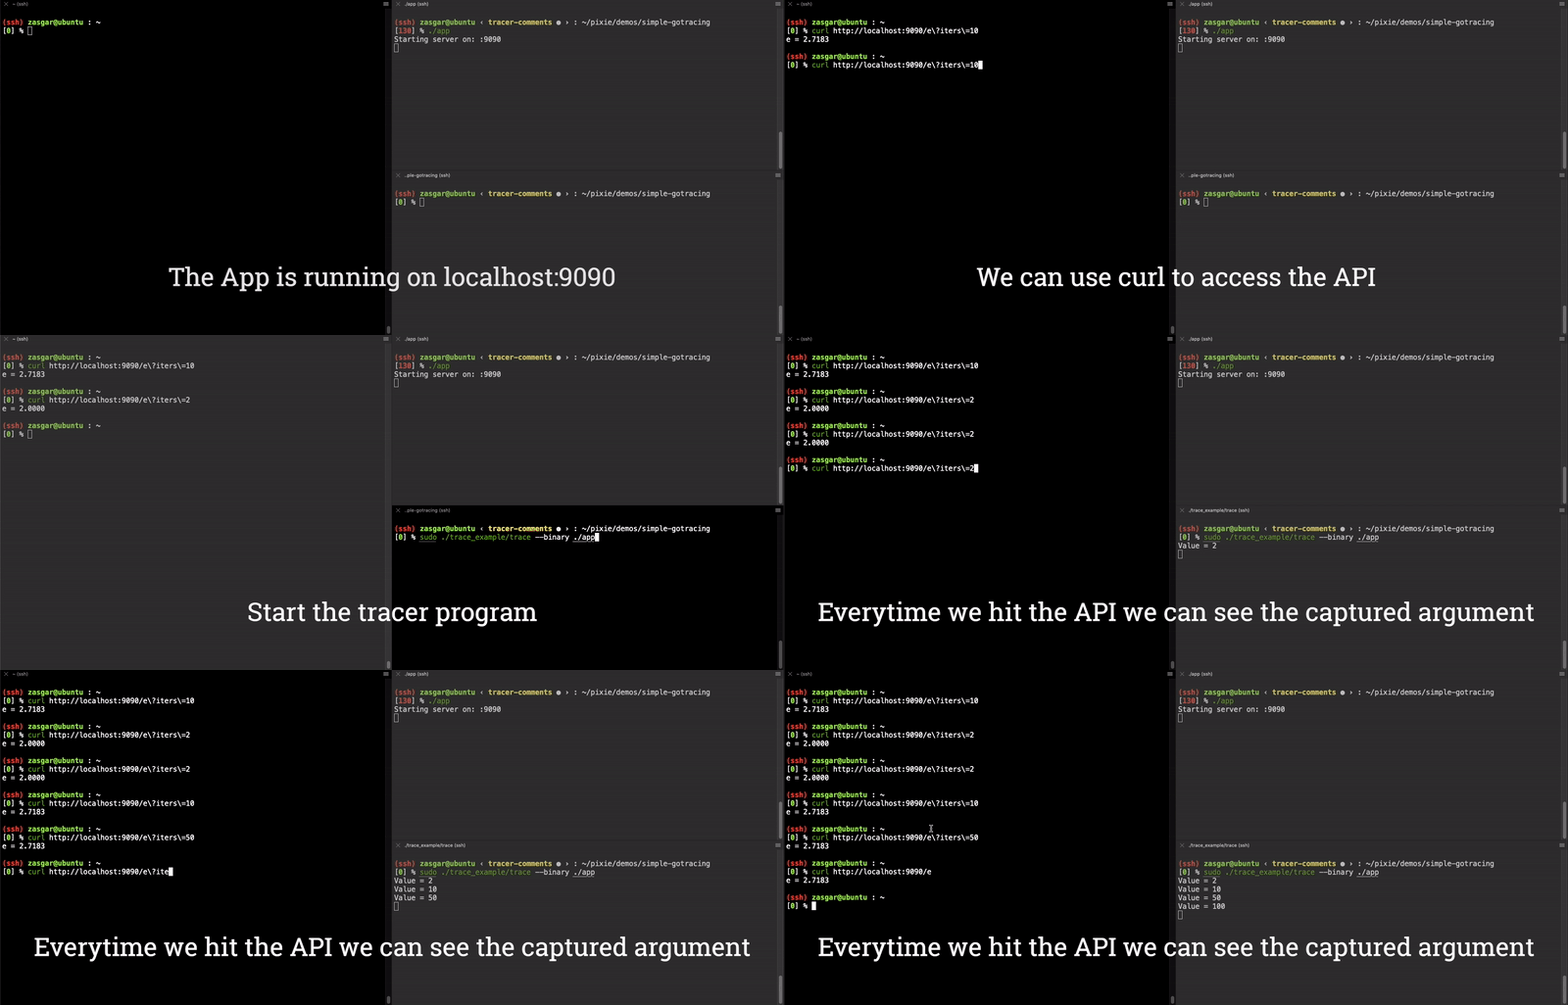
Now we have a fully functioning end-to-end argument tracer for the main.computeE function! The results of this are shown in the video clip below.

End-to-End demo
One of the cool things is that we can actually use GDB to see the modifications made to the binary. Here we dump out the instructions at the 0x6609a0 address, before running our tracer binary.
1(gdb) display /4i 0x6609a0210: x/4i 0x6609a03 0x6609a0 <main.computeE>: mov 0x8(%rsp),%rax4 0x6609a5 <main.computeE+5>: mov $0x2,%ecx5 0x6609aa <main.computeE+10>: movsd 0xfa616(%rip),%xmm06 0x6609b2 <main.computeE+18>: movsd 0xfa636(%rip),%xmm1
Here it is after we run the tracer binary. We can clearly see that the first instruction is now int3.
1(gdb) display /4i 0x6609a027: x/4i 0x6609a03 0x6609a0 <main.computeE>: int34 0x6609a1 <main.computeE+1>: mov 0x8(%rsp),%eax5 0x6609a5 <main.computeE+5>: mov $0x2,%ecx6 0x6609aa <main.computeE+10>: movsd 0xfa616(%rip),%xmm0
Although we hardcoded the tracer for this particular example, it's possible to make this process generalizable. Many aspects of Go, such as nested pointers, interfaces, channels, etc. make this process challenging, but solving these problems allows for another instrumentation mode not available in existing systems. Also, since this process works at the binary level, it can be used with natively compiled binaries for other languages (C++, Rust, etc.). We just need to account for the differences in their respective ABI's.
BPF tracing using uprobes comes with its own set of pros and cons. It's beneficial to use BPF when we need observability into the binary state, even when running in environments where attaching a debugger will be problematic or harmful (ex. production binaries). The biggest downside is the code required to get even trivial visibility into the application state. While BPF code is relatively accessible, it's complex to write and maintain. Without substantial high-level tooling, it's unlikely this can be used for generic debugging.
Go dynamic logging is something we are working on at Pixie. You can checkout this to see how Pixie traces Go applications running on K8s clusters. If this post's contents are interesting, please give Pixie a try, or check out our open positions.
- iovisor/gobpf
- iovisor/bcc
- GoPoland Meetup Video + Slides
- GoBangalore Meetup Video. Checkout Below:
Terms of Service|Privacy Policy
We are a Cloud Native Computing Foundation sandbox project.
Pixie was originally created and contributed by New Relic, Inc.
Copyright © 2018 - The Pixie Authors. All Rights Reserved. | Content distributed under CC BY 4.0.
The Linux Foundation has registered trademarks and uses trademarks. For a list of trademarks of The Linux Foundation, please see our Trademark Usage Page.
Pixie was originally created and contributed by New Relic, Inc.


