This is a guest tutorial by John Arundel, of Bitfield Consulting. Hang on tight as he takes you from zero to Pixie in a few thrill-packed minutes!
Pixie is a new software tool for monitoring and tracing software in Kubernetes clusters. It can generate automatic telemetry to help you live-debug your distributed system, without needing to instrument your application, or install complicated service mesh frameworks.
To learn more about how Pixie works, and why it's so valuable for SREs and infrastructure engineers, read my introductory post, Put a Little Pixie in Your Cluster.
In this tutorial, we'll see how to install the Pixie command-line tool, how to use it to deploy Pixie in your Kubernetes cluster, and how to start getting useful data on your requests and services.
Pixie has three main components:
The Pixie command-line interface (CLI) is your interface to Pixie, which you can use to install or update Pixie, run scripts and queries, and so on.
The Pixie edge module is the data-gathering software that runs on each Kubernetes node, tracking all the system calls and network traffic in and out of your services.
The Pixie command module is an application that runs in your Kubernetes cluster, collecting all the data reported by the edge modules and running queries received from the CLI tool.
There's also the Pixie control cloud, which handles authentication, admin, and so on, but you don't need to worry about this for now, because it's hosted by Pixie Labs, and your Pixie installation knows how to talk to it automatically.
Here's what you'll need in order to use Pixie. First, you'll need a machine to run the CLI tool on. At the moment, this will need to be either Linux or Mac, though support for other platforms is in the pipeline.
Second, you'll need a Kubernetes cluster to run the Pixie command module. If you don't already have one, or you don't want to use your existing cluster to try out Pixie, that's fine. Pixie will work with a local Kubernetes cluster on your machine, provided by tools like Docker Desktop, Minikube, and kind. Follow one of Pixie's handy install guides to set up a suitable cluster using the software of your choice.
Now read on!
The first thing we need to install is px, the Pixie CLI tool. Once we have px, we can use it to deploy the Pixie command module to the cluster and get to work.
Run this command in your Linux shell or Mac terminal:
1bash -c "$(curl -fsSL https://work.withpixie.ai/install.sh)"
If you want to know what the installer does before you run it, you can inspect the script for yourself and make sure you're happy with it. All it does is download the appropriate binary executable for your platform, move it to an appropriate directory, and then prompt you to authenticate with Pixie using your browser.
Let's see what that looks like:
1___ _ _2 | _ \(_)__ __(_) ___3 | _/| |\ \ /| |/ -_)4 |_| |_|/_\_\|_|\___|56==> Info:7Pixie gives engineers access to no-instrumentation, streaming &8unsampled auto-telemetry to debug performance issues in real-time,9More information at: https://www.pixielabs.ai.1011This command will install the Pixie CLI (px) in a location selected12by you, and performs authentication with Pixies cloud hosted control13plane. After installation of the CLI you can easily manage Pixie14installations on your K8s clusters and execute scripts to collect15telemetry from your clusters using Pixie.1617More Info:18 https://work.withpixie.ai/docs192021==> Installing PX CLI:22Install Path [/usr/local/bin]:
The default install path (/usr/local/bin) should be fine, unless you want to install px somewhere else (if so, enter the path here). Otherwise, just press Enter to continue.
1==> Authenticating with Pixie Cloud:2[0000] INFO Pixie CLI3Opening authentication URL: \4https://work.withpixie.ai:443/login?local_mode= \5true&redirect_uri=http%3A%2F%2Flocalhost%3A8085%2Fauth_complete6[0000] INFO Starting browser
This will open your browser to work.withpixie.ai, where you'll be prompted to log in (if you have an existing Pixie account) or sign up for a new account:

Once you're signed in, you're ready to get your Pixie on!
First, let's make sure we're pointing at the right cluster. Although Pixie can monitor activity across all your clusters, we only need to deploy the command module to one of them. A good choice for this would be the cluster where you run your existing monitoring tools, internal information systems, and so on.
Try this command to find out what your Kubernetes config says your current cluster is:
1kubectl config current-context23My-Awesome-Cluster
If the answer isn't what you were expecting, select the right cluster by running:
1kubectl config use-context My-Awesome-Cluster23Switched to context "My-Awesome-Cluster".
You're all set! Make Pixie go now:
1px deploy23Running Cluster Checks:4 ✔ Kernel version > 4.14.05 ✔ K8s version > 1.12.06 ✔ Kubectl > 1.10.0 is present7 ✔ User can create namespace8Installing version: 0.3.39Generating YAMLs for Pixie10 ✔ Generating namespace YAML11 ✔ Generating cert YAMLs12 ✔ Generating secret YAMLs13 ✔ Downloading Vizier YAMLs14Deploying Pixie to the following cluster: My-Awesome-Cluster1516Is the cluster correct? (y/n) [y] :
Assuming it is, press Enter to continue:
1Found 3 nodes2 ✔ Creating namespace3 ✔ Deleting stale Pixie objects, if any4 ✔ Deploying certs, secrets, and configmaps5 ✔ Deploying NATS6 ✔ Deploying etcd7 ✔ Deploying Cloud Connector8 ✔ Waiting for Cloud Connector to come online9Waiting for Pixie to pass healthcheck10 ✔ Wait for PEMs/Kelvin11 ✔ Wait for healthcheck1213==> Next Steps:1415Visit : https://work.withpixie.ai to use Pixie's UI.1617Run some scripts using the px cli. For example:18- px script list : to show pre-installed scripts.19- px run px/service_stats : to run service info for sock-shop demo application (service selection coming soon!).2021Check out our docs: https://work.withpixie.ai/docs.
That's it! You're Pixified and ready to roll.
If your cluster already has some services running in it, then Pixie will be able to give you some interesting data and views on them, so continue to the next section. If not, there's a demo application you can deploy using the CLI, to give Pixie something interesting to chew on:
1px demo deploy px-sock-shop23Deploying demo app px-sock-shop to the following cluster: JIMSv2-Test-Cluster45Is the cluster correct? (y/n) [y] :6 ✔ Creating namespace px-sock-shop7 ✔ Deploying px-sock-shop YAMLs8Successfully deployed demo app px-sock-shop to cluster JIMSv2-Test-Cluster9.10==> Next Steps:1112Load testing has been automatically launched for sock-shop. If you want to visit the sock-shop site,13run 'kubectl -n px-sock-shop get svc front-end --watch' to get the external IP.14When using minikube, run 'minikube tunnel' in order to ensure the external IP is accessible.15sock-shop may take a few more minutes to fully finish starting up.
Of course an application with no users isn't likely to generate much interesting activity for us to pore over with Pixie. So deploying the demo application also starts up a load test tool that generates a bunch of fake user traffic. Let's see what's happening!
Browse to this URL to get a look at what Pixie can tell us about activity on the cluster:
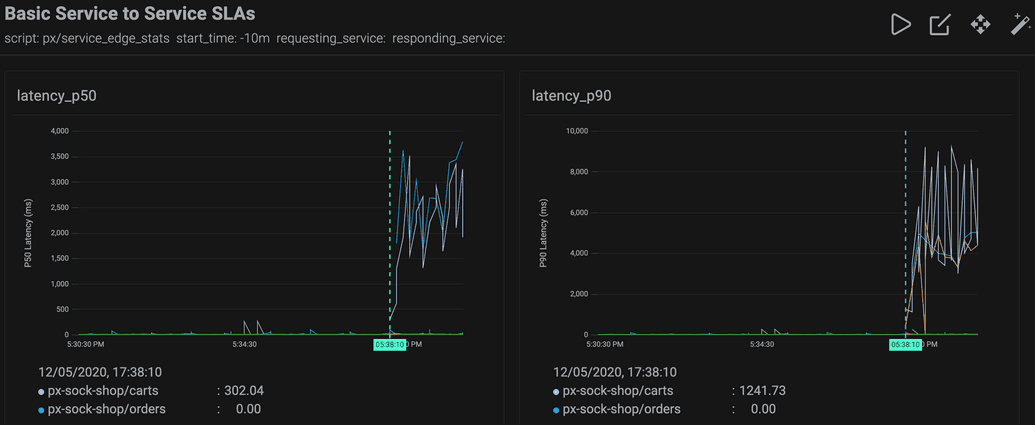
The first thing you'll see is the 'Service to Service SLAs' dashboard. The two graphs at the top show latency (request duration) against time:

This kind of display will be familiar to SREs, and you may already have something similar if you're using Prometheus and Grafana, for example.
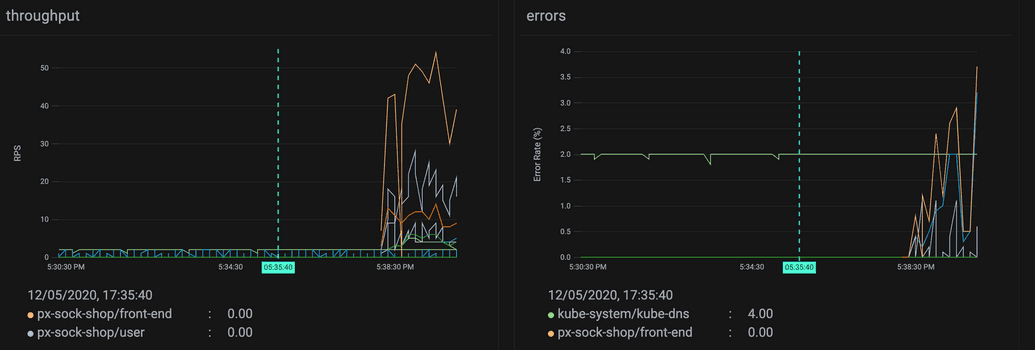
Next is the throughput (requests handled per second), and the error rate, as a percentage of requests:

While it's helpful to see this information in graph form, we can get a much more detailed view of the same data using the CLI tool:
1px run px/service_stats23Table ID: Request Latency Histogram4 REQUEST LATENCY MS COUNT5 150 12176 ...7 9000 188Table ID: Status Code Distribution9 HTTP RESP STATUS COUNT10 500 187511 301 212 101 213 406 274814 404 239515 202 1021116 201 1556517 200 8523318Table ID: p90 Latency19 TIME K8S LATENCY P50 LATENCY P90 LATENCY P99 ERROR RATE RPS BYTES PER S20 2020-05-12T17:43:40+01:00 px-sock-shop/shipping 1.62 4.00 14.59 0.00 2 20521 2020-05-12T17:50:40+01:00 px-sock-shop/front-end 44.60 2569.34 6515.74 6.70 88 316722 2020-05-12T17:41:20+01:00 px-sock-shop/user 2.65 10.49 35.50 0.00 56 1790723 2020-05-12T17:43:00+01:00 px-sock-shop/front-end 57.47 3075.91 7900.93 2.40 78 280724 2020-05-12T17:43:00+01:00 pl/vizier-certmgr 0.35 0.35 0.35 0.00 0 1625 2020-05-12T17:46:40+01:00 px-sock-shop/front-end 3.74 4876.09 5807.39 1.30 18 65726 2020-05-12T17:42:50+01:00 px-sock-shop/payment 0.38 0.69 1.76 0.00 8 45027 ...
There's a ton of data here and, usefully, we can also get it in JSON format, for analysis with jq and other JSON processing tools:
1px run px/service_stats -o json |jq -r .
1{2 "_tableName_": "Request Latency Histogram",3 "request_latency_ms": 150,4 "count": 169485}6{7 "_tableName_": "Request Latency Histogram",8 "request_latency_ms": 3600,9 "count": 1210}11...
If this makes you as joyful as I think it will, you'll want to play around with Pixie now and see what else it can do. Go ahead and experiment! Try whatever commands you want: it's quite safe. px commands won't affect anything else running on your cluster.
The service_stats data we've been looking at it is just one of the query scripts supplied with Pixie. Try this command to see what other scripts are available:
1px script list23Table ID: script_list4 NAME DESCRIPTION5 px/agent_status Get agent status.6 px/cql_data Sample CQL Data7 px/cql_stats CQL Pod LET metrics8 px/funcs Get a list all of all funcs9 available in Pixie.10 px/http_data Sample HTTP Data11 px/http_request_stats HTTP Requests Statistics by12 Service13 px/jvm_data JVM stats14 px/jvm_stats JVM Stats per Pod15 px/largest_http_request Largest HTTP Request16 ...
...and many more! Have fun with Pixie, and stay tuned for the next tutorial in this series, where we'll go a little deeper and see what else Pixie can do.
Terms of Service|Privacy Policy
We are a Cloud Native Computing Foundation sandbox project.
Pixie was originally created and contributed by New Relic, Inc.
Copyright © 2018 - The Pixie Authors. All Rights Reserved. | Content distributed under CC BY 4.0.
The Linux Foundation has registered trademarks and uses trademarks. For a list of trademarks of The Linux Foundation, please see our Trademark Usage Page.
Pixie was originally created and contributed by New Relic, Inc.


