Go is a garbage collected language. This makes writing Go simpler, because you can spend less time worrying about managing the lifetime of allocated objects.
Memory management is definitely easier in Go than it is in, say, C++. But it’s also not an area we as Go developers can totally ignore, either. Understanding how Go allocates and frees memory allows us to write better, more efficient applications. The garbage collector is a critical piece of that puzzle.
In order to better understand how the garbage collector works, I decided to trace its low-level behavior on a live application. In this investigation, I'll instrument the Go garbage collector with eBPF uprobes. The source code for this post lives here.
Before diving in, let's get some quick context on uprobes, the garbage collector's design, and the demo application we'll be using.
uprobes are cool because they let us dynamically collect new information without modifying our code. This is useful when you can’t or don’t want to redeploy your app - maybe because it’s in production, or the interesting behavior is hard to reproduce.
Function arguments, return values, latency, and timestamps can all be collected via uprobes. In this post, I'll deploy uprobes onto key functions from the Go garbage collector. This will allow me to see how it behaves in practice in my running application.
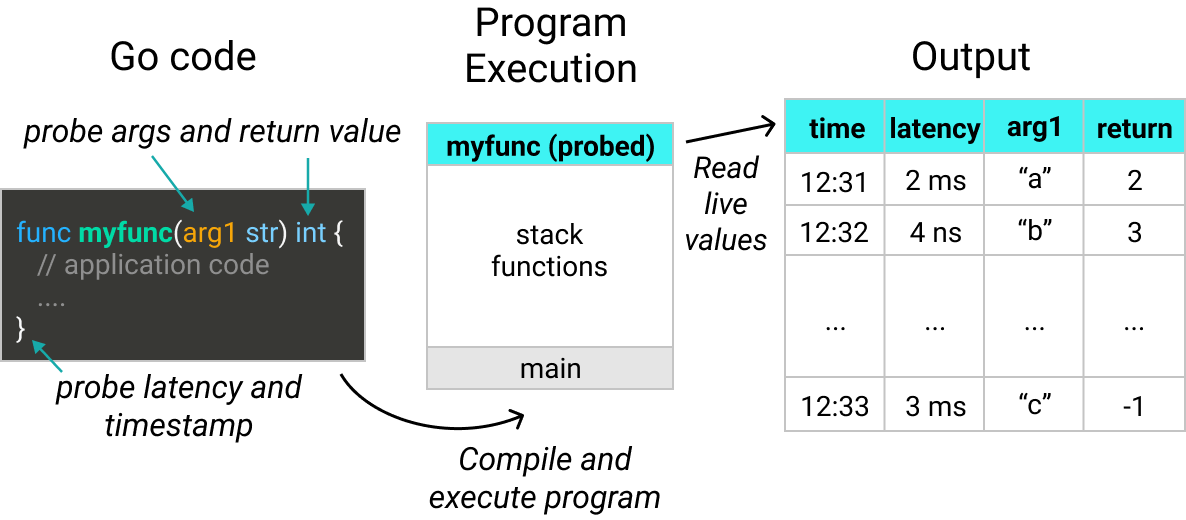
uprobes can trace latency, timestamp, arguments, and return values of functions.
Note: this post uses Go 1.16. I will trace private functions in the Go runtime. However, these functions are subject to change in later releases of Go.
Go uses a concurrent mark and sweep garbage collector. For those unfamiliar with the terms, here is a quick summary so you can understand the rest of the post. You can find more detailed information here, here, here, and here.
Go's garbage collector is called concurrent because it can safely run in parallel with the main program. In other words, it doesn’t need* to halt the execution of your program to do its job. (*more on this later).
There are two major phases of garbage collection:
Mark phase: Identify and mark the objects that are no longer needed by the program.
Sweep phase: For every object marked “unreachable” by the mark phase, free up the memory to be used elsewhere.

A node coloring algorithm. Black objects are still in use. White objects are ready to be cleaned up. Gray objects still need to be categorized as either black or white.
Here is a simple endpoint that I’ll use in order to trigger the garbage collector. It creates a variably-sized string array. Then it invokes the garbage collector via runtime.GC().
Usually, you don't need to call the garbage collector manually, because Go handles that for you. However, this guarantees it kicks in after every API call.
http.HandleFunc("/allocate-memory-and-run-gc", func(w http.ResponseWriter, r *http.Request) {arrayLength, bytesPerElement := parseArrayArgs(r)arr := generateRandomStringArray(arrayLength, bytesPerElement)fmt.Fprintf(w, fmt.Sprintf("Generated string array with %d bytes of data\n", len(arr) * len(arr[0])))runtime.GC()fmt.Fprintf(w, "Ran garbage collector\n")})
Now that we have some context on uprobes and the basics of Go's garbage collector, let's dive in to observing its behavior.
First, I decided to add uprobes to following functions in Go's runtime library.
| Function | Description |
|---|---|
| GC | Invokes the GC |
| gcWaitOnMark | Waits for the mark phase to complete |
| gcSweep | Performs the sweep phase |
(If you’re interested in seeing how the uprobes were generated, here's the code.)
After deploying the uprobes, I hit the endpoint and generated an array containing 10 strings that are each 20 bytes.
$ curl '127.0.0.1/allocate-memory-and-run-gc?arrayLength=10&bytesPerElement=20'Generated string array with 200 bytes of dataRan garbage collector
The deployed uprobes observed the following events after that curl call:
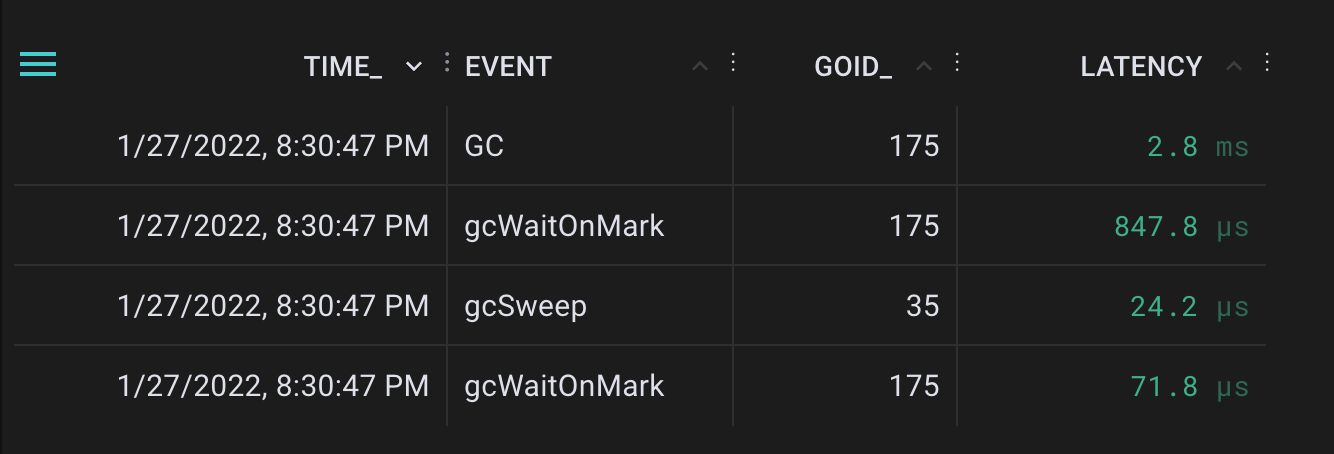
Events were collected for GC, gcWaitOnMark, and gcSweep after running the garbage collector
This makes sense from the source code - gcWaitOnMark is called twice, once as a validation for the prior cycle before starting the next cycle. The mark phase triggers the sweep phase.
Next, I took some measurements for runtime.GC latency after hitting the /allocate-memory-and-run-gc endpoint with a variety of inputs.
| arrayLength | bytesPerElement | Approximate size (B) | GC latency (ms) | GC throughput (MB/s) |
|---|---|---|---|---|
| 100 | 1,000 | 100,000 | 3.2 | 31 |
| 1,000 | 1,000 | 1,000,000 | 8.5 | 118 |
| 10,000 | 1,000 | 10,000,000 | 53.7 | 186 |
| 100 | 10,000 | 1,000,000 | 3.2 | 313 |
| 1,000 | 10,000 | 10,000,000 | 12.4 | 807 |
| 10,000 | 10,000 | 100,000,000 | 96.2 | 1,039 |
While that was a good high level view, we could use more detail. Next, I probed some helper functions for memory allocation, marking, and sweeping to get the next level of information.
These helper functions have arguments or return values that will help us better visualize what is happening (e.g. pages of memory allocated).
| Function | Description | Info captured |
|---|---|---|
| allocSpan | Allocates new memory | Pages of memory allocated |
| gcDrainN | Performs N units of marking work | Units of marking work performed |
| sweepone | Sweeps memory from a span | Pages of memory swept |
$ curl '127.0.0.1/allocate-memory-and-run-gc?arrayLength=20000&bytesPerElement=4096'Generated string array with 81920000 bytes of dataRan garbage collector
After hitting the garbage collector with a bit more load, here are the raw results:
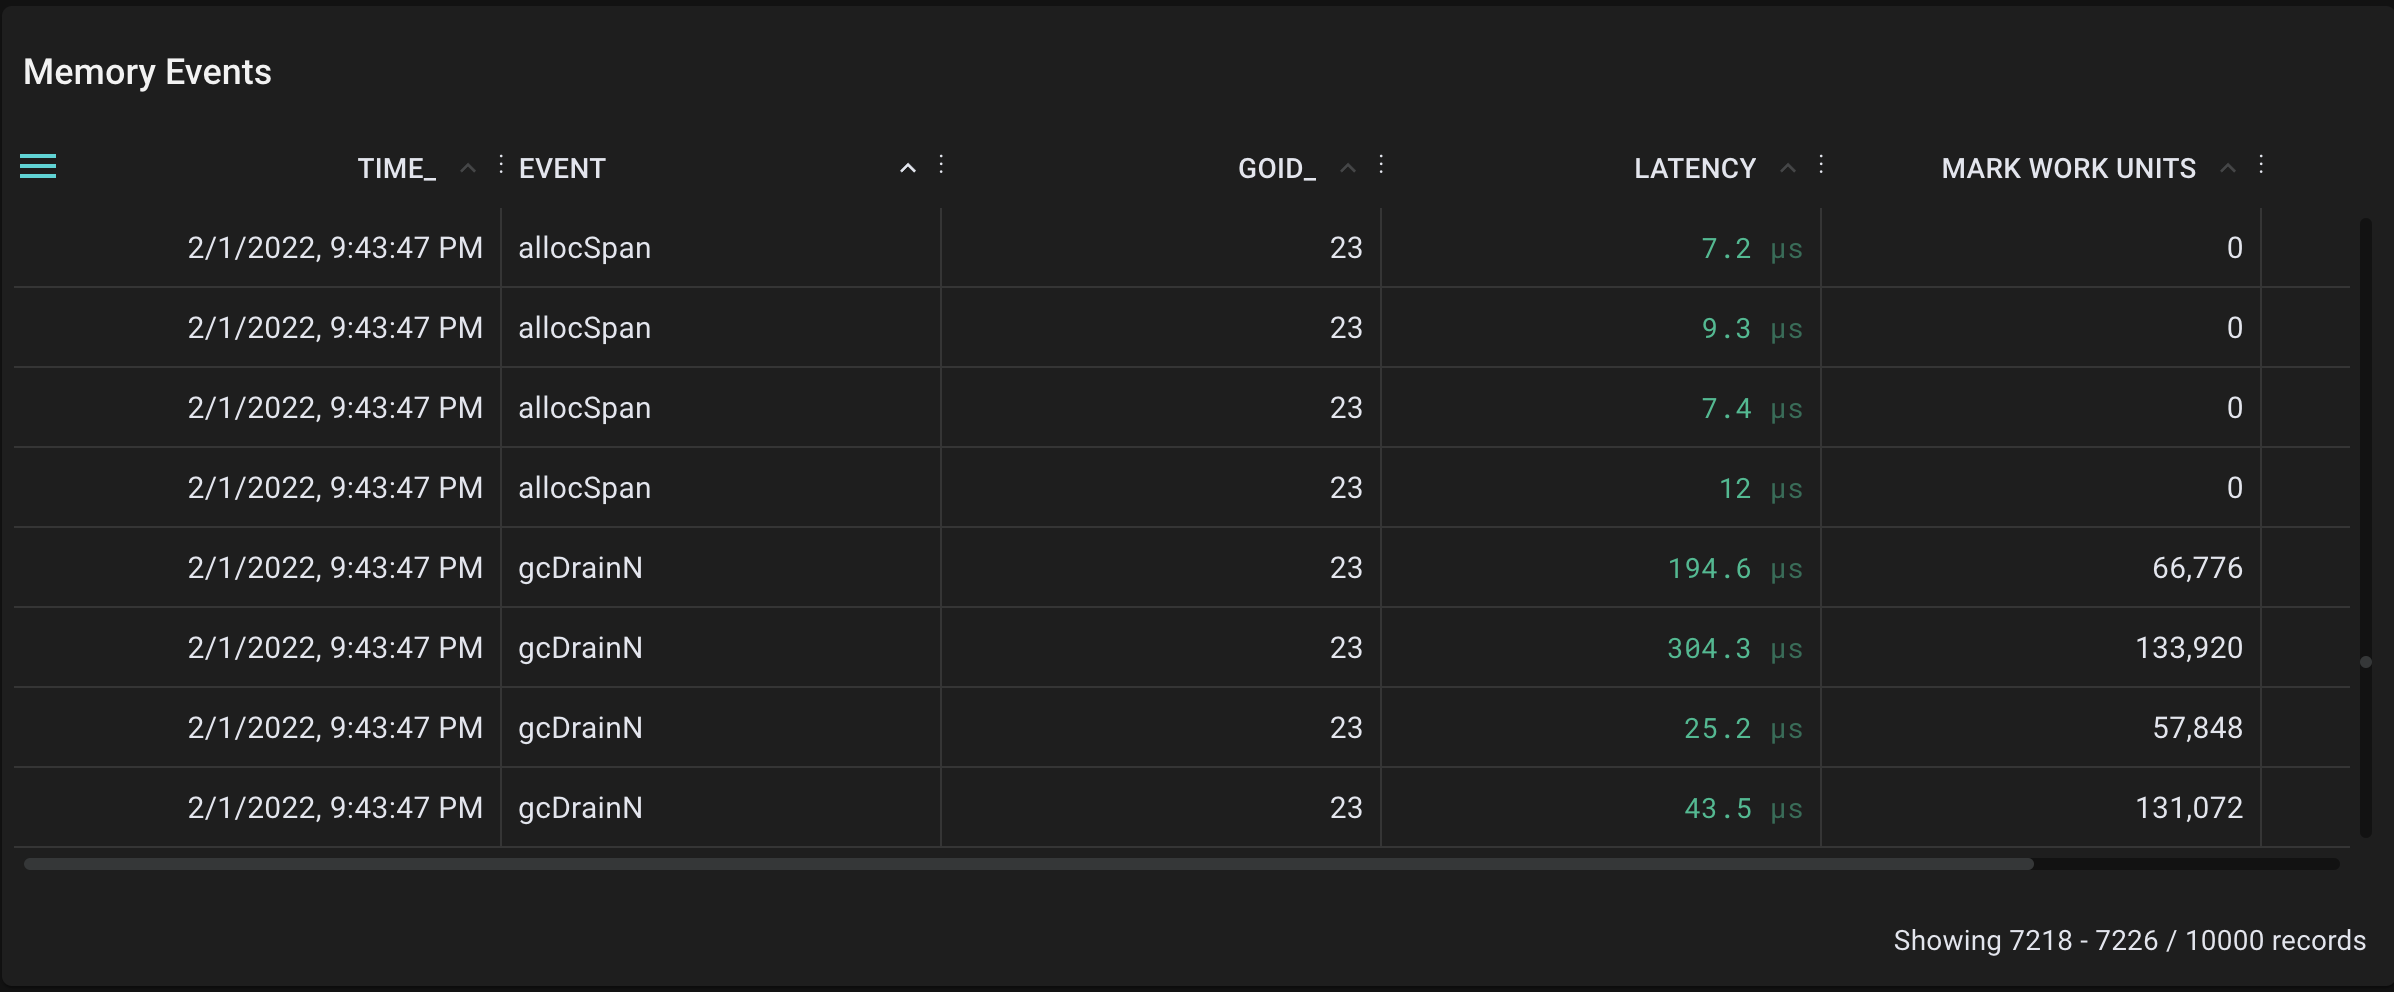
Sample of collected events for allocSpan, gcDrainN, and sweepone after an invocation of the garbage collector
They’re easier to interpret when plotted as a timeseries:
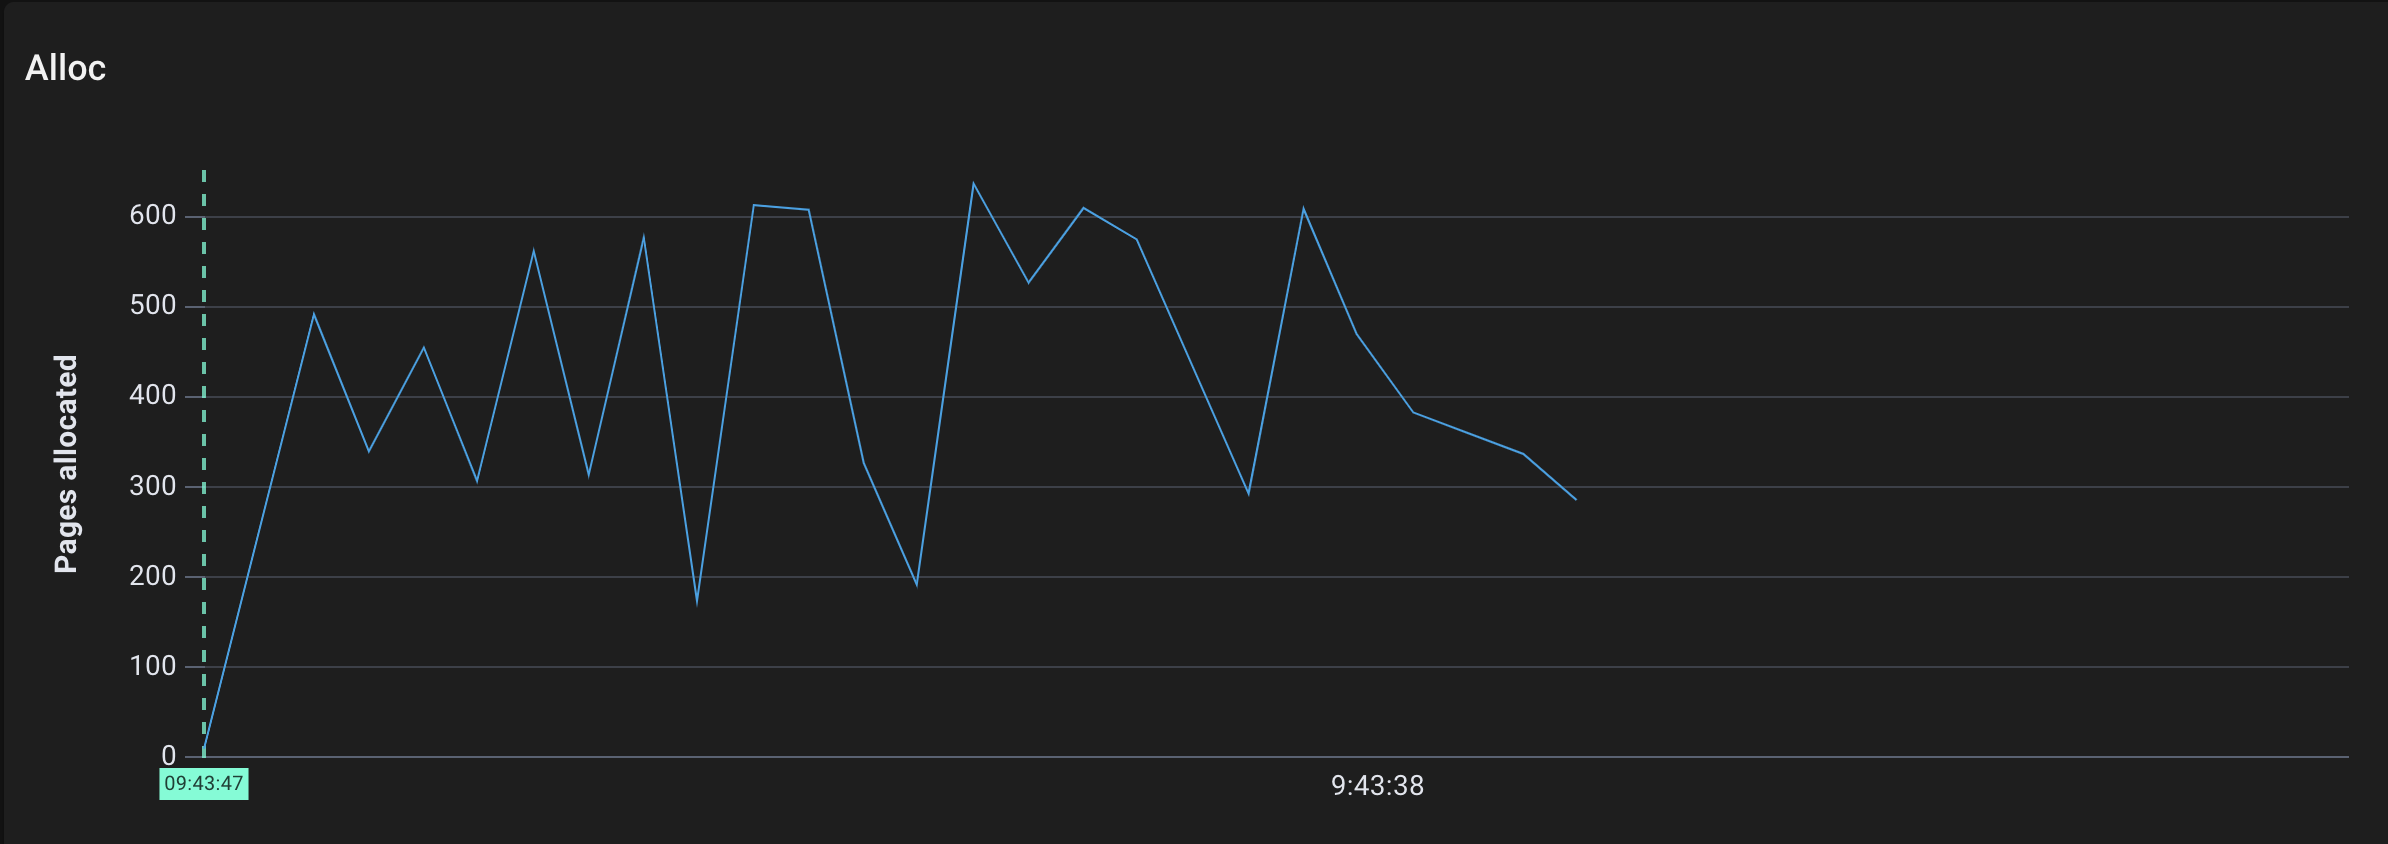
Pages allocated by allocSpan over time
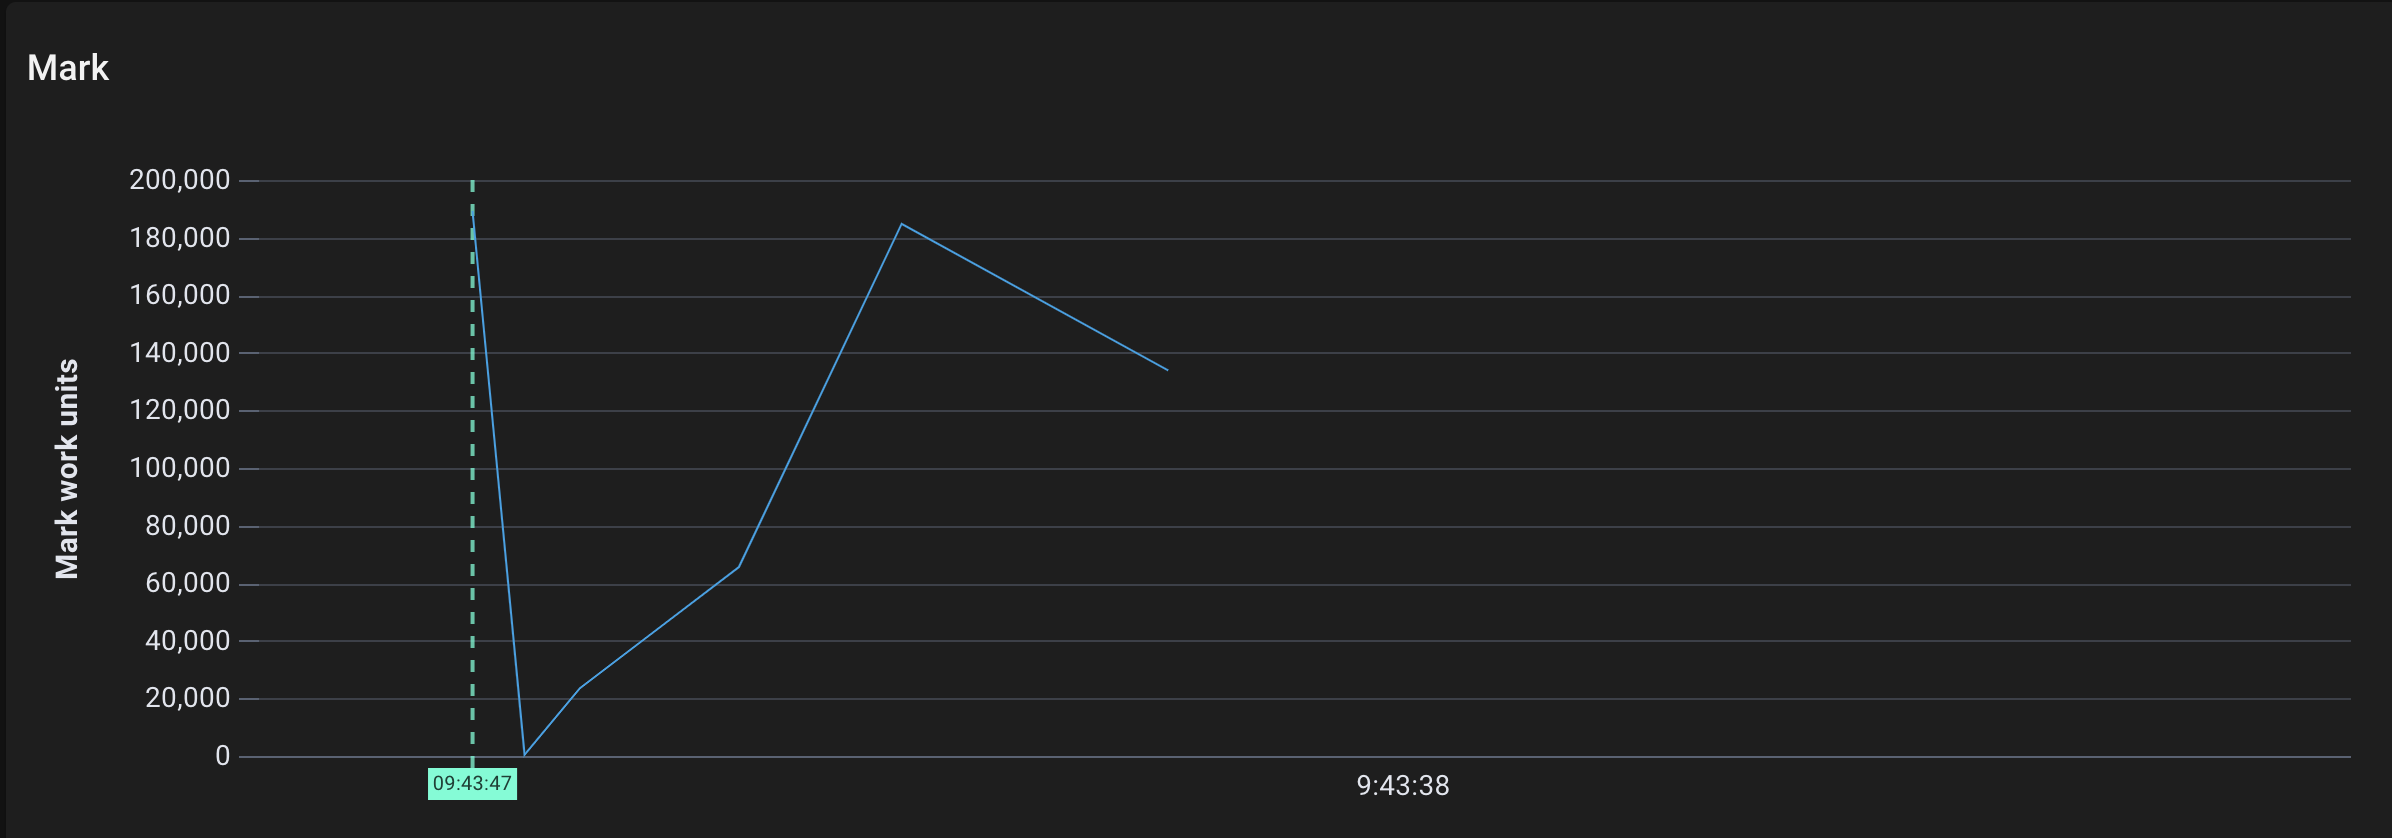
Mark work performed by gcDrain over time
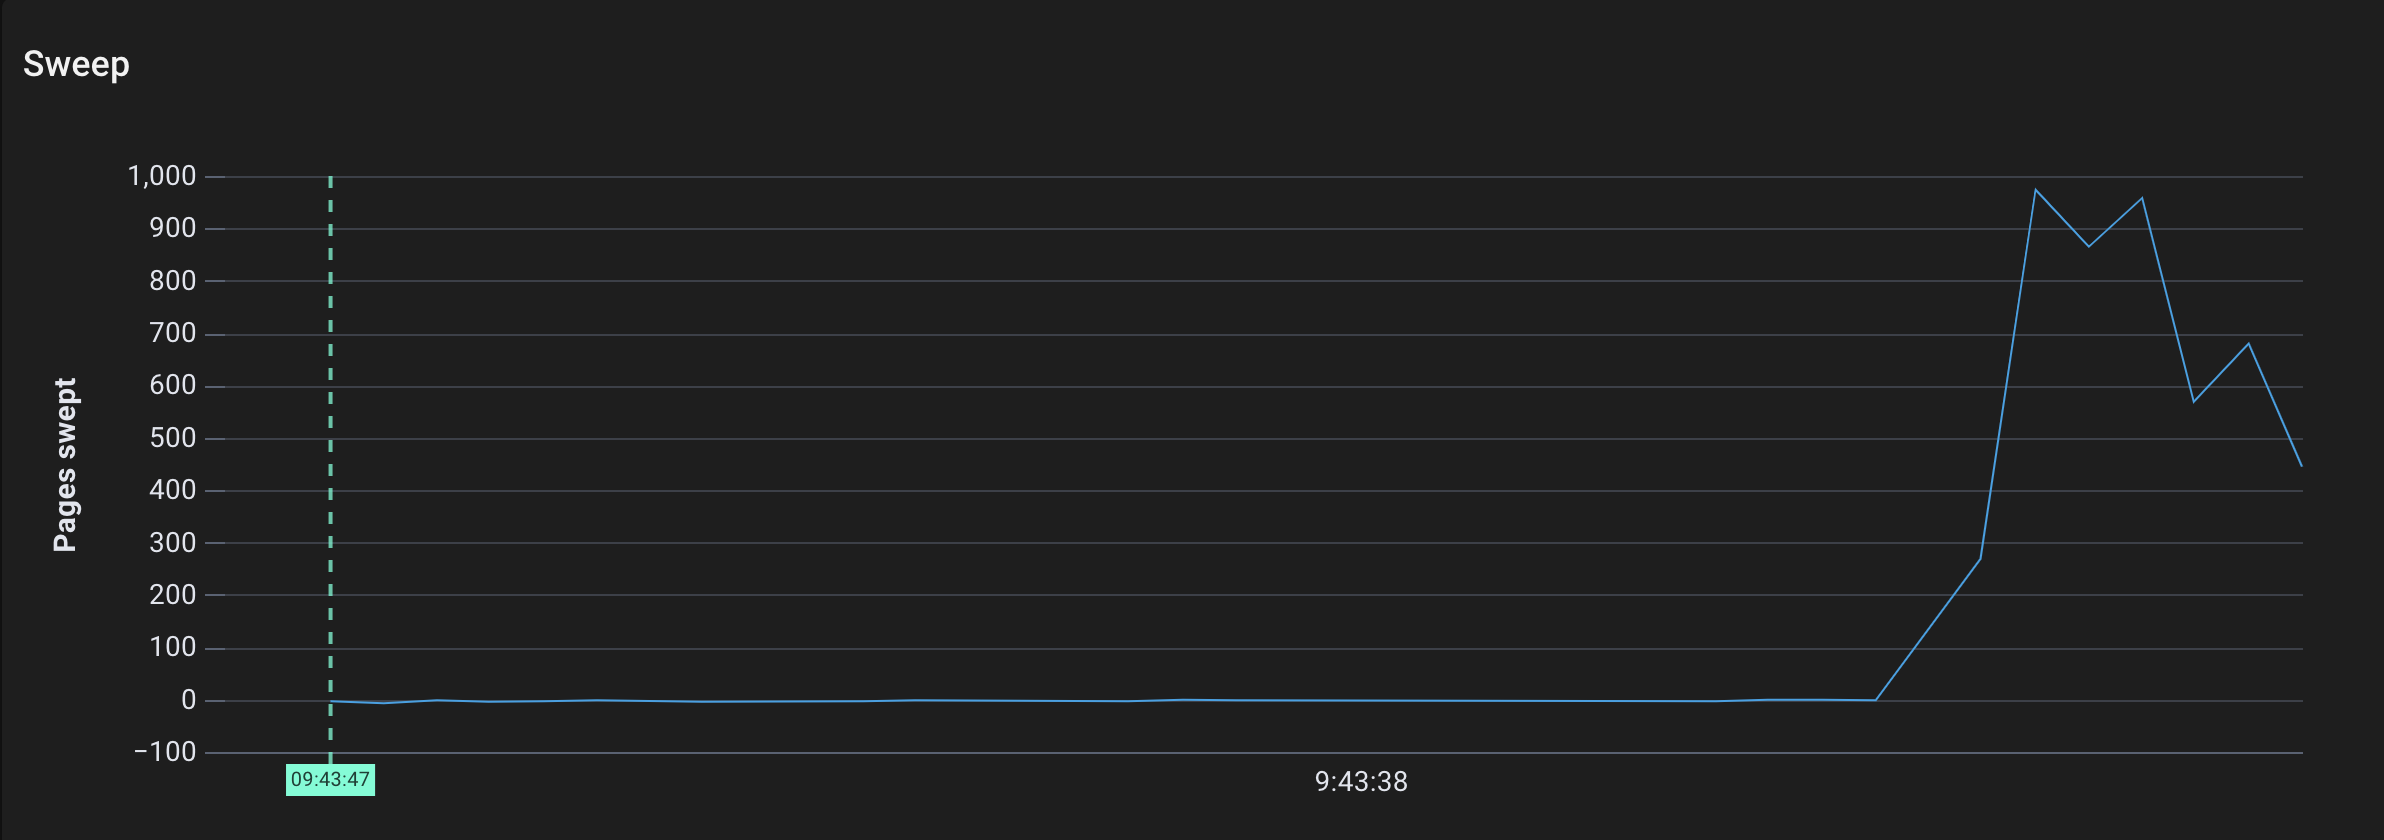
Pages swept by sweepone over time
Now we can see what happened:
- Go allocated a few thousand pages, which makes sense since we directly added ~80MB of strings to the heap.
- The mark work kicked off (note that its units are not pages, but mark work units)
- The marked pages were swept by the sweeper. (This should be all of the pages, since we don’t reuse the string array after the call completes).
“Stopping the world” refers to the garbage collector temporarily halting everything but itself in order to safely modify the state. We generally prefer to minimize STW phases, because they slow our programs down (usually when it’s most inconvenient…).
Some garbage collectors stop the world the entire time garbage collection is running. These are “non concurrent” garbage collectors. While Go’s garbage collector is largely concurrent, we can see from the code that it does technically stop the world in two places.
Let's trace the following functions:
| Function | Description |
|---|---|
| stopTheWorldWithSema | Halts other goroutines until startTheWorldWithSema is called |
| startTheWorldWithSema | Starts the halted goroutines back up |
And trigger garbage collection again:
$ curl '127.0.0.1/allocate-memory-and-run-gc?arrayLength=10&bytesPerElement=20'Generated string array with 200 bytes of dataRan garbage collector
The following events were produced by the new probes:
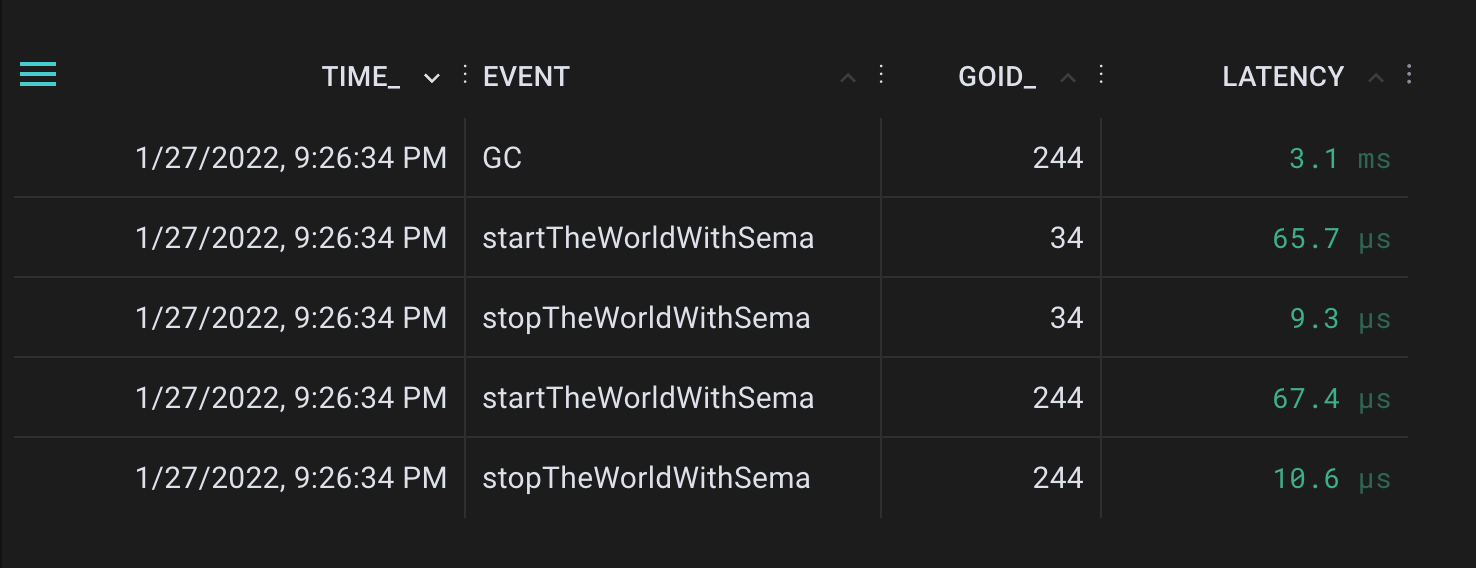
Generated start and stop the world events
We can see from the GC event that garbage collection took 3.1 ms to complete. After I inspected the exact timestamps, it turns out the world was stopped for 300 µs the first time and 365 µs the second time. In other words, ~80% of the garbage collection was performed concurrently. We would expect this ratio to get even better when the garbage collector was invoked “naturally” under real memory pressure.
Why does the Go garbage collector need to stop the world?
1st Stop The World (before mark phase): Set up state and turn on the write barrier. The write barrier ensures that new writes are correctly tracked when GC is running (so that they are not accidentally freed or kept around).
2nd Stop The World (after mark phase): Clean up mark state and turn off the write barrier.
Knowing when to run garbage collection is an important consideration for concurrent garbage collectors like Go’s.
Earlier generations of garbage collectors were designed to kick in once they reached a certain level of memory consumption. This works fine if the garbage collector is non-concurrent. But with a concurrent garbage collector, the main program is still running during garbage collection - and therefore still allocating memory.
This means we can overshoot the memory goal if we run the garbage collector too late. (Go can’t just run garbage collection all of the time, either - GC takes away resources and performance from the main application.)
Go’s garbage collector uses a pacer to estimate the optimal times for garbage collection. This helps Go meet its memory and CPU targets without sacrificing more application performance than necessary.
As we just established, Go’s concurrent garbage collector relies on a pacer to determine when to do garbage collection. But how does it make that decision?
Every time the garbage collector is called, the pacer updates its internal goal for when it should run GC next. This goal is called the trigger ratio. A trigger ratio of 0.6 means that the system should run garbage collection again once the heap has gone up 60% in size. The trigger ratio factors in CPU, memory, and other factors to generate this number.
Let’s see how the garbage collector’s trigger ratio changes when we allocate a lot of memory at once. We can grab the trigger ratio by tracing the function gcSetTriggerRatio.
$ curl '127.0.0.1/allocate-memory-and-run-gc?arrayLength=20000&bytesPerElement=4096'Generated string array with 81920000 bytes of dataRan garbage collector
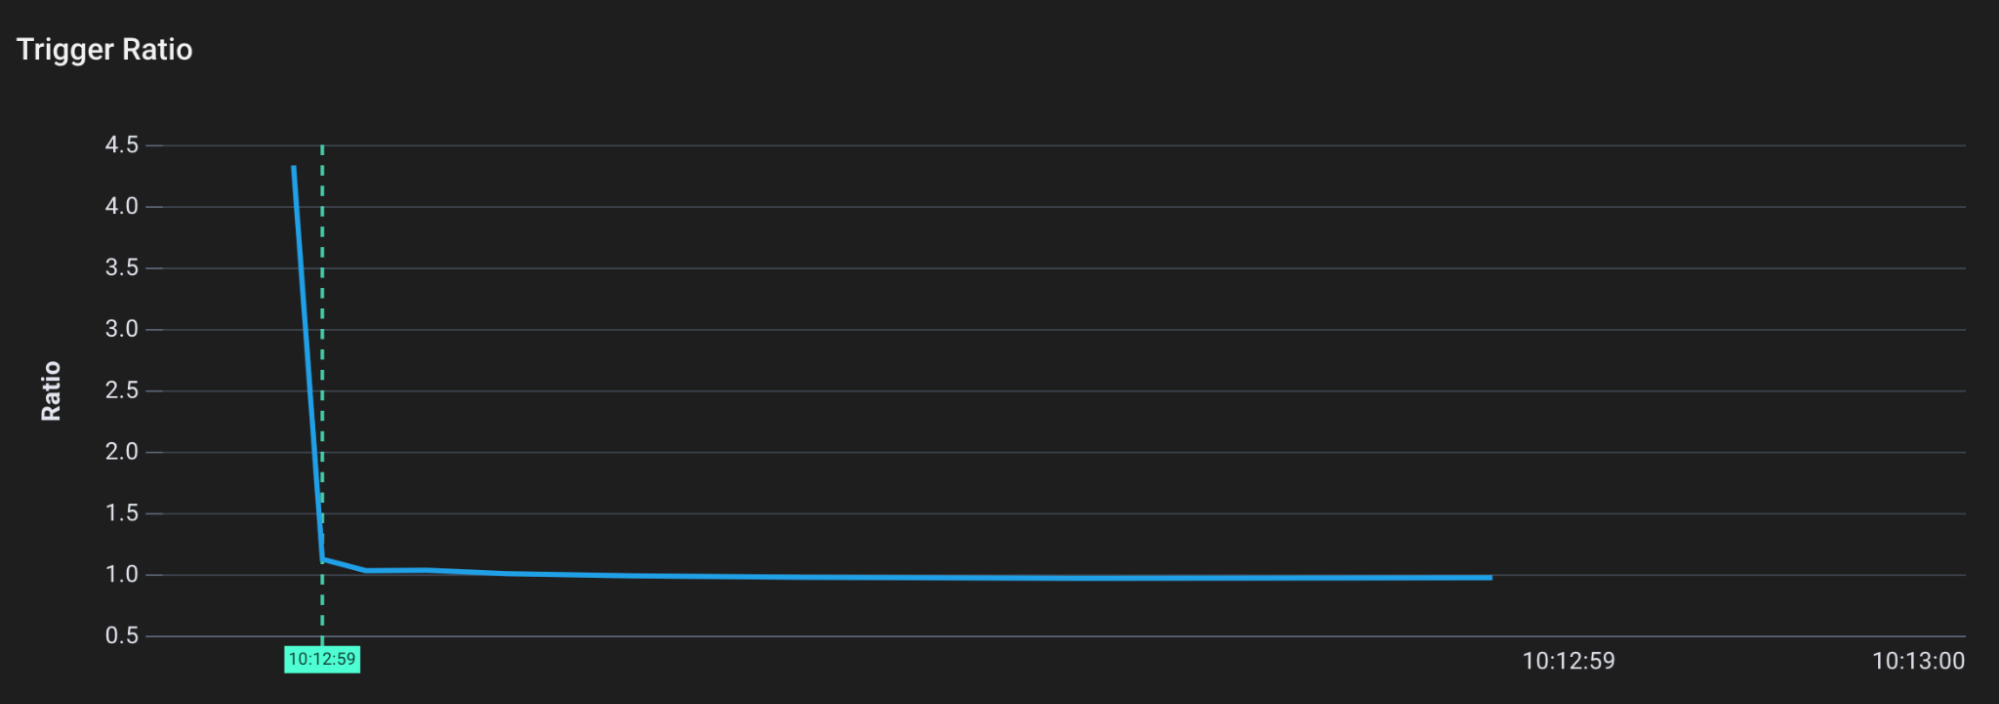
Trigger ratio over time
We can see that initially, the trigger ratio is quite high. The runtime has determined that garbage collection won’t be necessary until the program is using 450% more memory. This makes sense, because the application isn’t doing much (and not using much of the heap).
However, once we hit the endpoint to create ~81MB of heap allocations, the trigger ratio quickly drops to ~1. Now we need only 100% more memory before garbage collection should occur (since our memory consumption rose).
What happens when I allocate memory, but don’t call the garbage collector? Next I’ll hit the /allocate-memory endpoint, which does the same thing as /allocate-memory-and-gc but skips the call to runtime.GC().
$ curl '127.0.0.1/allocate-memory?arrayLength=10000&bytesPerElement=10000'Generated string array with 100000000 bytes of data
Based on the most recent trigger ratio, the garbage collector shouldn’t have kicked in yet. However, we see that marking and sweeping still occurs:
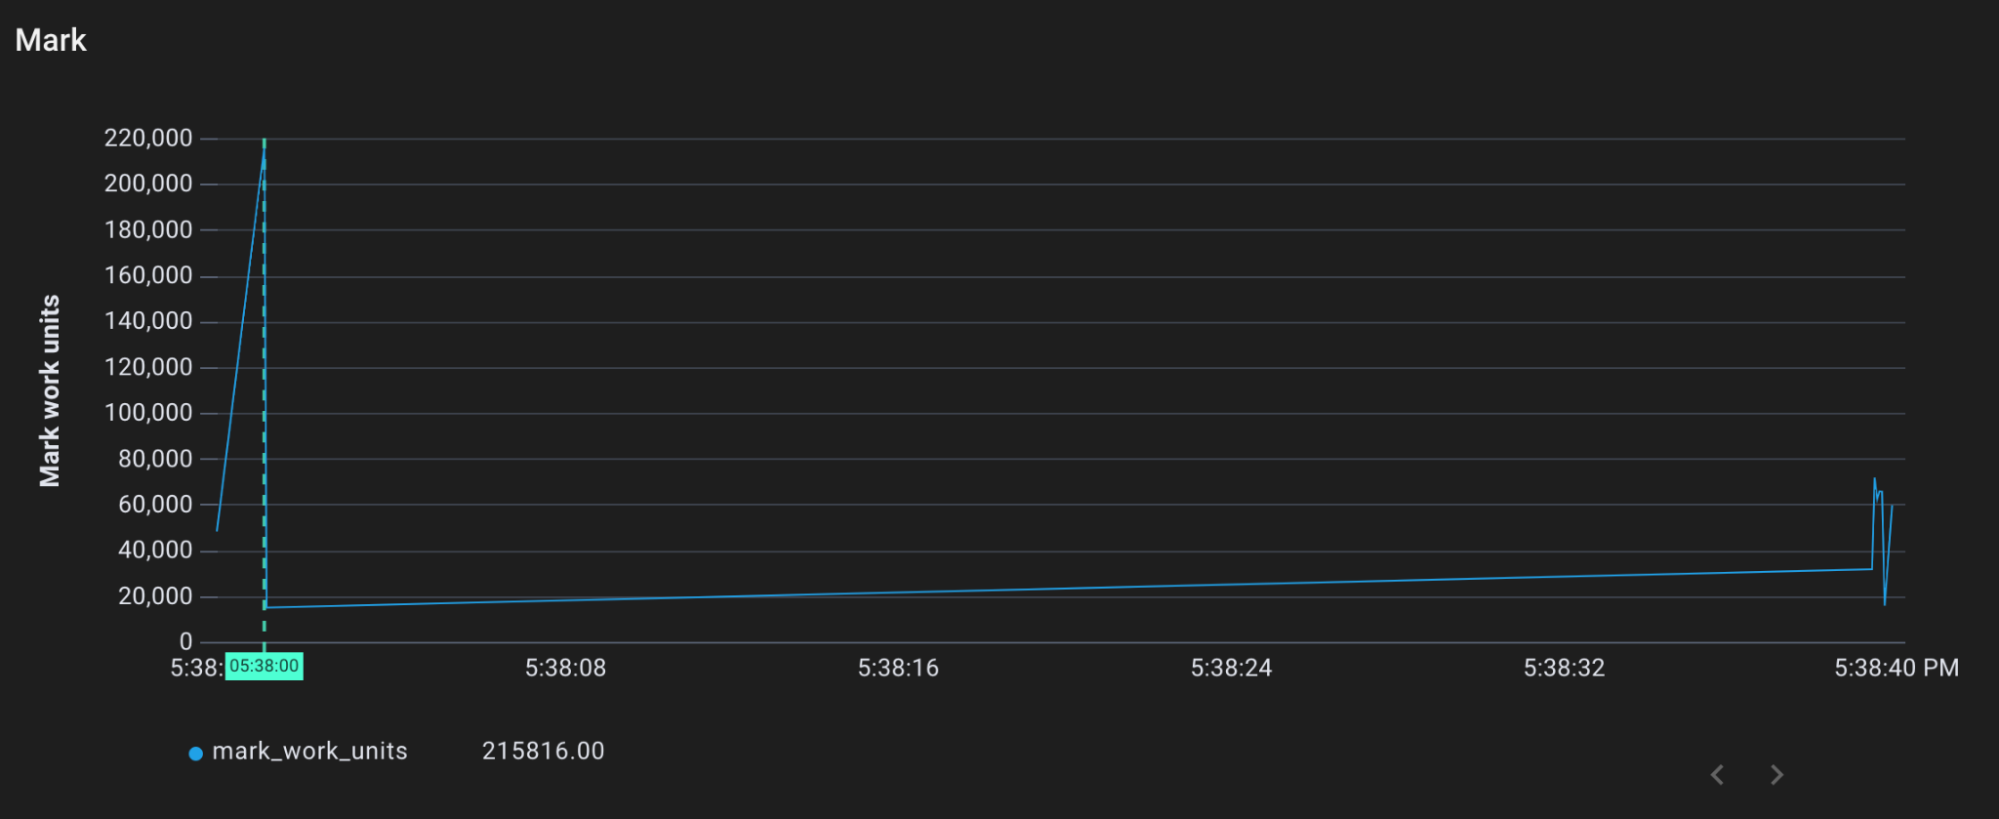
Mark work performed by gcDrain over time
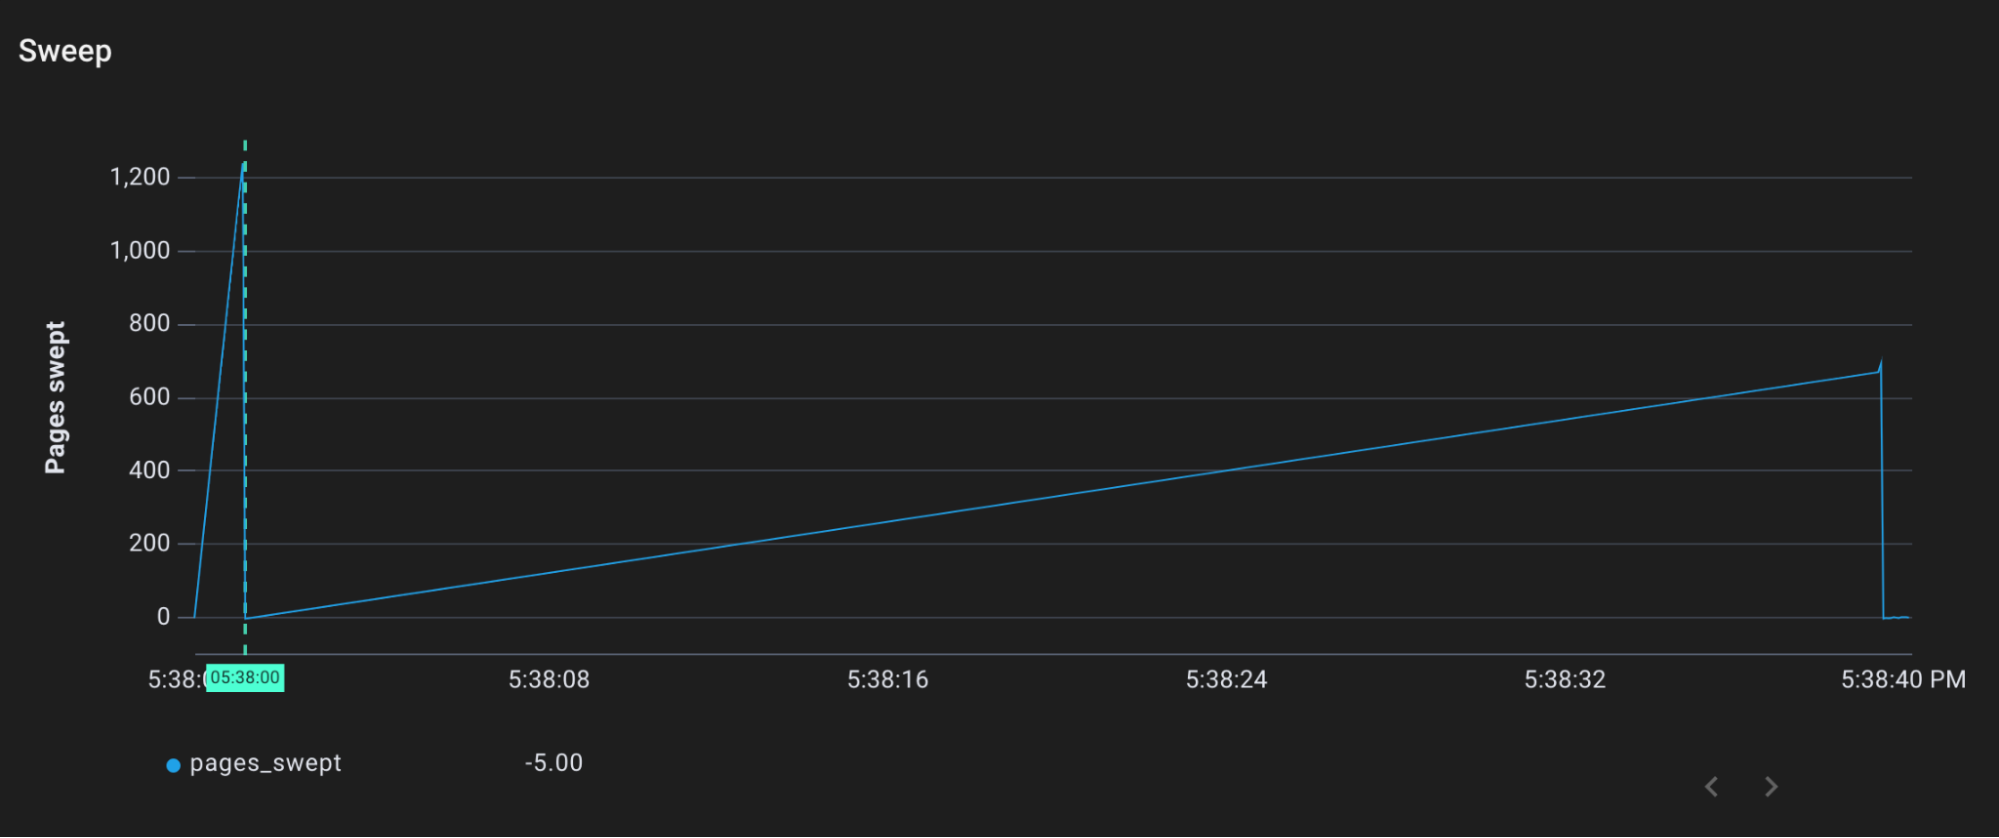
Pages swept by sweepone over time
It turns out, the garbage collector has another trick up its sleeve to prevent out of control memory growth. If heap memory starts to rise too fast, the garbage collector will charge a “tax” to anyone allocating new memory. Goroutines requesting new heap allocations will first have to assist with garbage collection before getting what they asked for.
This “assist” system adds latency to the allocation and therefore helps to backpressure the system. It’s really important, because it solves a problem that can arise from concurrent garbage collectors. In a concurrent garbage collector, memory allocation is still being allocated while garbage collection runs. If the program is allocating memory faster than the garbage collector is freeing it, then memory growth will be unbounded. Assists address this issue by slowing down (backpressuring) the net allocation of new memory.
We can trace gcAssistAlloc1 to see this process in action. gcAssistAlloc1 takes in an argument called scanWork, which is the amount of assist work requested.
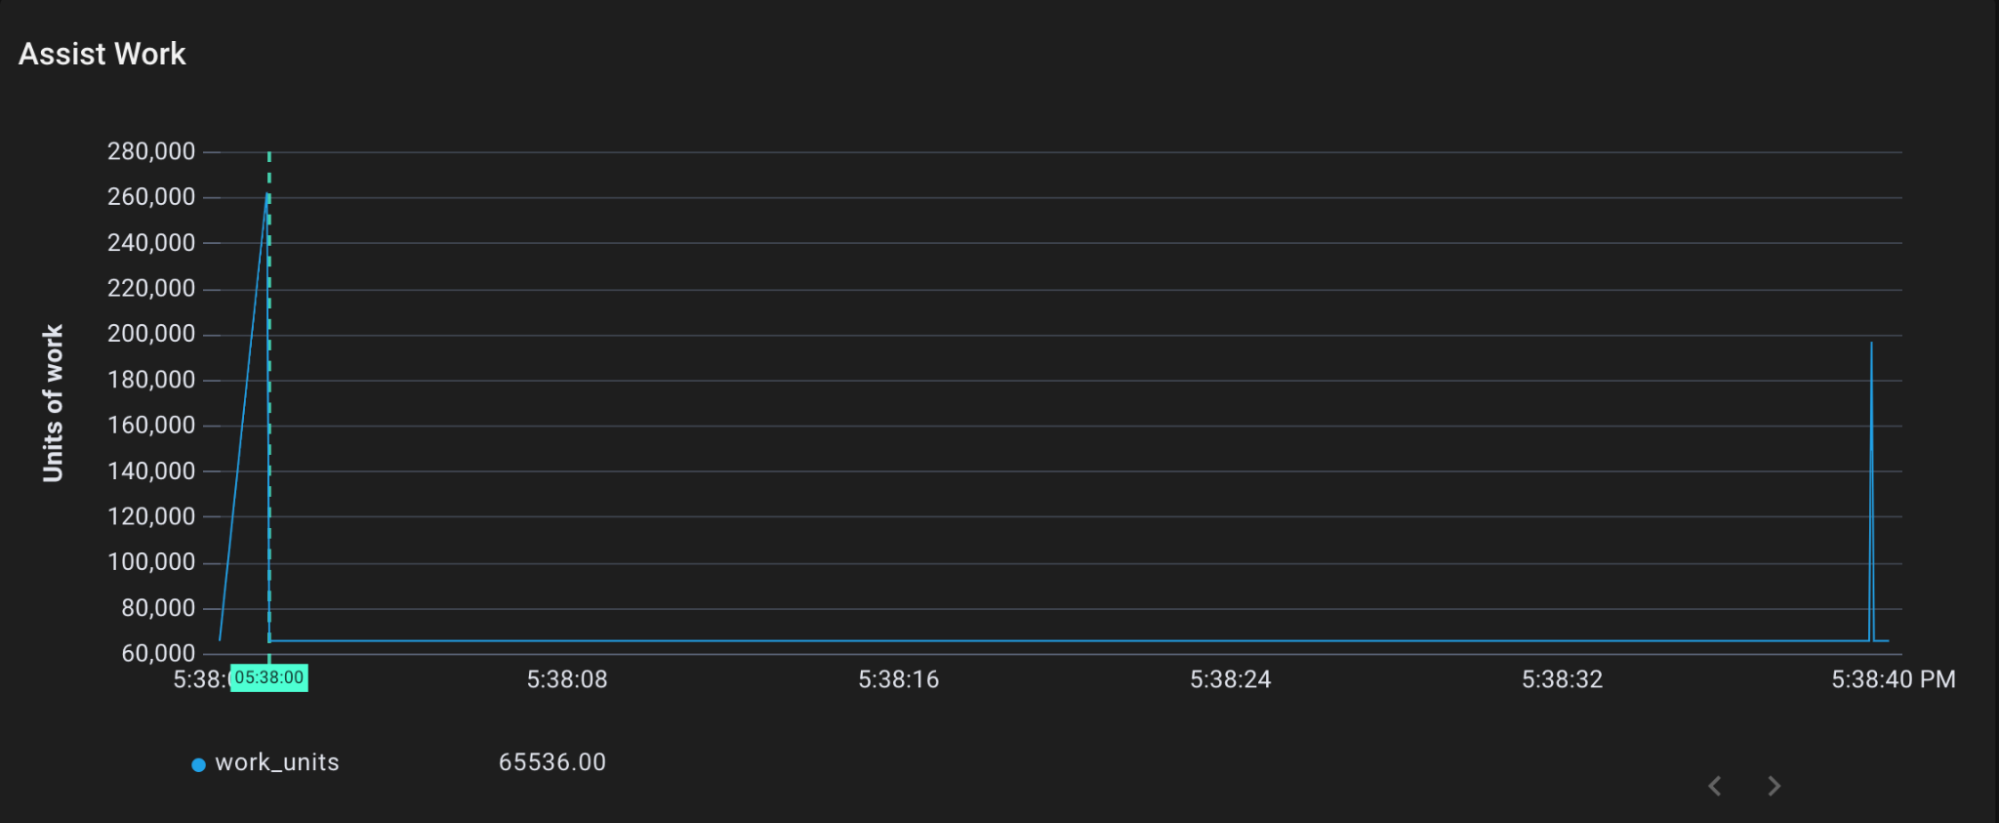
Assist work performed by gcAllocAssist1 over time
We can see that gcAssistAlloc1 is the source of the mark and sweep work. It receives a request to fulfill about 300,000 units of work. In the previous mark phase diagram, we can see that gcDrainN performs about 300,000 units of mark work at that same time (just spread out a bit).
There’s a lot more to learn about memory allocation and garbage collection in Go! Here’s some other resources to check out:
- Go’s special sweeping of small objects
- How to run escape analysis on your code to see if objects will be allocated to the stack or the heap
- sync.Pool, a concurrent data structure that reduces allocations by pooling shared objects
Creating uprobes, like we did in this example, is usually best done in a higher level BPF framework. For this post, I used Pixie’s Dynamic Go logging feature (which is still in alpha). bpftrace is another great tool for creating uprobes. You can try out the entire example from this post here.
Another good option for inspecting the behavior of the Go garbage collector is the gc tracer. Just pass in GODEBUG=gctrace=1 when you start your program. It requires a restart, but will tell you all kinds of cool information about what the garbage collector is doing.
Questions? Find the Pixie contributors on Slack or Twitter at @pixie_run.
Terms of Service|Privacy Policy
We are a Cloud Native Computing Foundation sandbox project.
Pixie was originally created and contributed by New Relic, Inc.
Copyright © 2018 - The Pixie Authors. All Rights Reserved. | Content distributed under CC BY 4.0.
The Linux Foundation has registered trademarks and uses trademarks. For a list of trademarks of The Linux Foundation, please see our Trademark Usage Page.
Pixie was originally created and contributed by New Relic, Inc.


