Export Pixie data in the OpenTelemetry format.Learn more🚀
Pixie has an OpenTelemetry plugin!
Ctrl/Cmd + K
Distributed bpftrace with Pixie

Arnold van Wijnbergen
October 27, 2021 • 5 minutes readLead Observability Expert (SME), Principal Architect @ Fullstaq
I recently heard about Pixie: an open source debug platform for microservices-based applications. Pixie is built using Linux eBPF (enhanced Berkeley Packet Filter) technology, which promises to provide automatic monitoring. In addition to the protocols it natively traces, Pixie has a feature that enables us to execute bpftrace-like scripts on the cluster, which is great. After seeing the Pixie Launch in April 2021, I decided to investigate Pixie and its bpftrace feature.
To get a first glance of the actual implementation, I started with Pixie's reference video in which they convert bpftrace’s tcp-retransmit.bt to an actual PxL script. In that Youtube video everything seemed well explained, so I proceeded with my journey.
In this post, I'll show you how you can deploy bpftrace code with Pixie and share the converted bpftrace tool scripts that I've contributed to Pixie.
bpftrace Background
If you are not familiar with bpftrace, no problem. bpftrace is a tool that provides a high-level tracing language for eBPF. In the background it uses the BCC Toolkit (IO Visor project) and LLVM to compile all scripts to BPF-bytecode. It supports Kernel probes (Kprobes), user-level probes (Uprobes) and tracepoints. bpftrace itself is highly inspired by tools like awk, sed and tracers like DTrace and SystemTap, with the result that we can create awesome one-liners.
This makes the tool very powerful, but also has a downside since it can only run locally and doesn’t provide functionality to run distributed on remote systems, nor has a central UI.
Pixie can help us make these parts easier. Pixie can distribute eBPF programs across Kubernetes clusters and provides tables that can be easily queried from both a UI, CLI, or API.
Modifying sleepy_snoop to work with Pixie
Let's develop our first bpftrace PxL script. For this example, we will use a famous one-liner, which we will call sleepy_snoop. Let's first look at the actual code itself.
kprobe:do_nanosleep { printf("PID %d sleeping\n", pid); }

Pixie requires some minor adjustments to make this code work inside a PxL script:
- First, we have to escape the
printfdouble quotes. - We need one
printfstatement that includes field names as actual output to the Pixie table, so we have to adjust theprintfstatements in thekprobe:do_nanosleepblock to include thepidcolumn name. - Additionally, we are going to enrich the output with the timestamp and process name. We can natively use
nsecswith fieldnametime_. This field is recognized by Pixie and automatically shown as human readable datetime format. For recording the process name, we use the built-incommvariable.
The converted eBPF program should look like this:
kprobe:do_nanosleep { printf(\"time_:%llu pid:%d comm:%s\", nsecs, pid, comm); }
Running sleepy_snoop from the Pixie CLI
Now that we have the eBPF code, we can create the actual PxL script. You can find a copy of this script here.
# Import Pixie's modules for creating traces & querying dataimport pxtraceimport px# Adapted from https://brendangregg.comprogram = """kprobe:do_nanosleep { printf(\"time_:%llu pid:%d comm:%s\", nsecs, pid, comm); }"""# sleepy_snoop_func function to create a tracepoint# and start the data collection.def sleepy_snoop_func():table_name = 'sleepy_snoop_table'pxtrace.UpsertTracepoint('sleepy_snoop_tracer',table_name,program,pxtrace.kprobe(),"10m")df = px.DataFrame(table=table_name)return dfoutput = sleepy_snoop_func();# display the tracepoint table datapx.display(output)
This script looks a bit different from the PxL scripts which simply query already-collected data. In short, we:
- Import both
pxandpxtracelibraries. - Create a
programvariable that contains the BPF code. - Create a function to execute the tracepoint collection. In our case
sleepy_snoop_func. - Define the target Pixie table to put the results into, called
sleepy_snoop_table. - Define the Tracepoint to start the Kprobe, called
sleepy_snoop_tracer. This includes a time-to-live of10m, which automatically removes the eBPF probes 10 minutes after the last script execution. - Create a
DataFrameobject from the table of results and display it in the UI.
You can run the script using Pixie's CLI:
px run -f sleepy_snoop.pxl
For more help on how to use Pixie's CLI, see the tutorial.
An example of the CLI output is included below. Note that in some cases you may need to run the script twice. This is because a script may not have collected any data to display yet on the first run.
px run -f sleepy_snoop.pxlPixie CLITable ID: outputTIME PID COMM2021-09-27 20:11:15.546971049 +0200 CEST 12123 pem2021-09-27 20:11:15.614823431 +0200 CEST 4261 k8s_metadata2021-09-27 20:11:15.615110023 +0200 CEST 4261 k8s_metadata2021-09-27 20:11:15.615132796 +0200 CEST 8077 metadata2021-09-27 20:11:15.615196553 +0200 CEST 4261 k8s_metadata2021-09-27 20:11:15.621200052 +0200 CEST 4261 k8s_metadata2021-09-27 20:11:15.621290646 +0200 CEST 4261 k8s_metadata2021-09-27 20:11:15.621375788 +0200 CEST 4261 k8s_metadata2021-09-27 20:11:15.546333885 +0200 CEST 6952 containerd-shim2021-09-27 20:11:15.546344427 +0200 CEST 1495 containerd2021-09-27 20:11:15.546366425 +0200 CEST 1495 containerd2021-09-27 20:11:15.546429576 +0200 CEST 1495 containerd2021-09-27 20:11:15.564011412 +0200 CEST 3563 containerd-shim2021-09-27 20:11:15.566385845 +0200 CEST 1603 kubelet2021-09-27 20:11:15.566485594 +0200 CEST 1603 kubelet2021-09-27 20:11:15.615859719 +0200 CEST 4261 k8s_metadata
Congratulations, you have successfully created and deployed your first eBPF program with Pixie!
Running sleepy_snoop from the Pixie UI
We can also run this script using Pixie's UI:
- Open the Pixie's UI
- Select
Scratch Padfrom thescriptdrop-down menu at the top. - Open the script editor using
ctrl+e(Windows, Linux) orcmd+e(Mac) and paste in the script from the previous section. Close the editor using the same keyboard command. - Press the
RUNbutton in the top right corner.
Running the sleepy_snoop.pxl script in Pixie's UI
After a successful run you will get the first results back on the left side of your window, which will be the table view with three columns: TIME_, PID and COMM. As mentioned before, this sleepy_snoop traces all pids that are calling sleep. You can click on a table row to see the row data in JSON form.
Real-life demonstration using OOM Killer Tracepoint
Let’s do one more example by looking for OOM killed processes. In short, OOM means Out-Of-Memory and we can easily simulate this on our Kubernetes cluster with the demo code found here. To trace for these events we will use the oomkill.bt tool.
Let's first look at the original code:
#include <linux/oom.h>BEGIN{printf("Tracing oom_kill_process()... Hit Ctrl-C to end.\n");}kprobe:oom_kill_process{$oc = (struct oom_control *)arg0;time("%H:%M:%S ");printf("Triggered by PID %d (\"%s\"), ", pid, comm);printf("OOM kill of PID %d (\"%s\"), %d pages, loadavg: ",$oc->chosen->pid, $oc->chosen->comm, $oc->totalpages);cat("/proc/loadavg");}
As mentioned before, we have to make some minor adjustments to get this working as a PxL script:
- First, we will start removing the BEGIN block, since we don’t need this
printfstatement. - We can only have one
printfstatement that includes field names as actual output to the Pixie table, so we have to combine bothprintfstatements in thekprobe:oom_kill_processblock. - We remove the
timefunction, since we can natively usensecswith fieldname_time. - We remove the
catfunction, since this isn’t yet usable within Pixie.
End result of the eBPF program should look like this:
kprobe:oom_kill_process{$oc = (struct oom_control *)arg0;printf(\"time_:%llu triggered_by_pid:%d triggered_by_comm:%s killed_pid:%d killed_comm:%s pages:%d\",nsecs, pid, comm, $oc->chosen->pid, $oc->chosen->comm, $oc->totalpages);}
For convenience, we can use Pixie's existing bpftrace/oom_kill script. Select this script from the script drop-down menu in the UI.
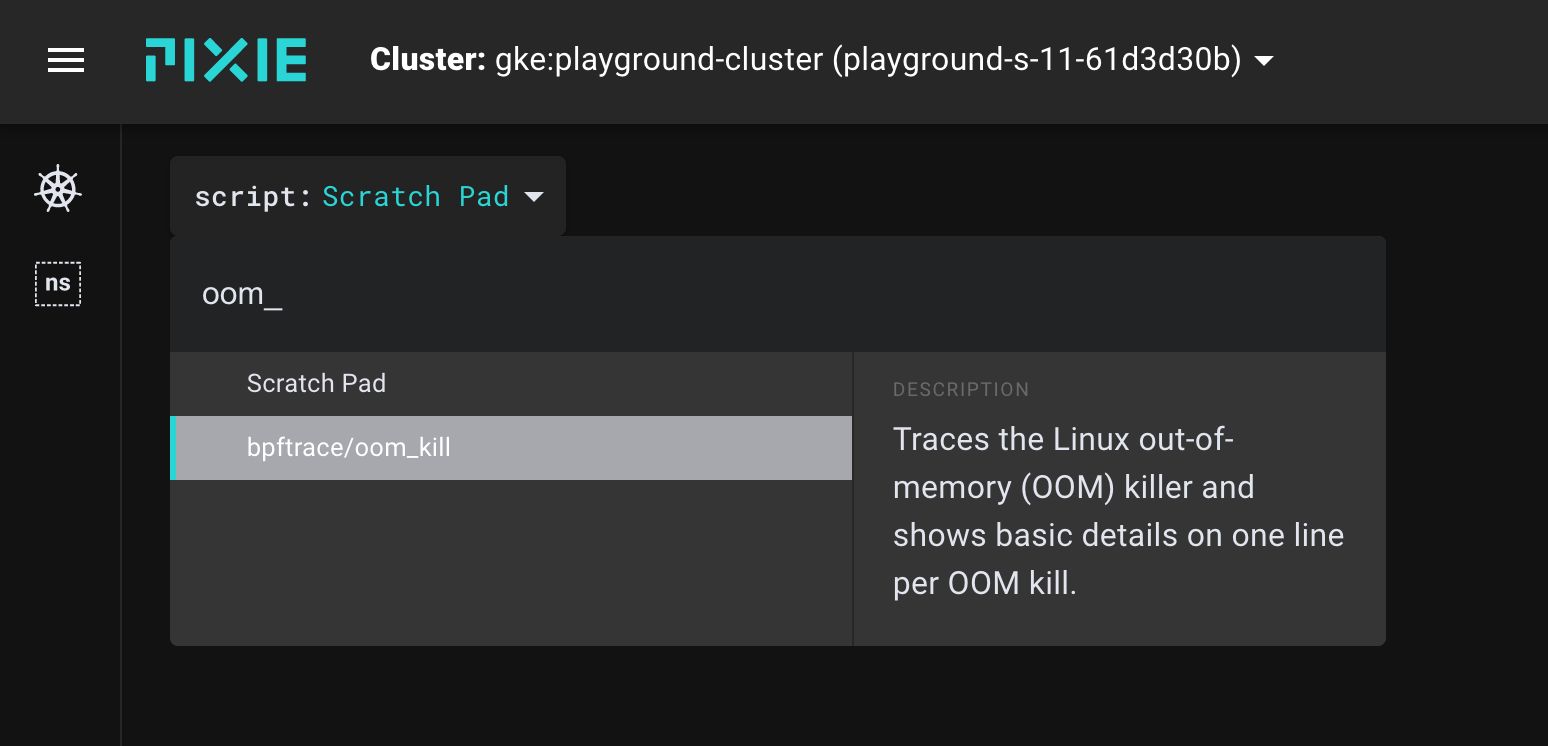
Select bpftrace/oom_kill from the script menu in the UI.
Now run the script and look to see if you have OOM events occurring. Under normal circumstances, you shouldn't see any OOM events.
Now, let’s now trigger the OOM killer by applying the following container:
cat <<EOF | kubectl apply -f -apiVersion: v1kind: Podmetadata:name: memleaky-appspec:containers:- name: memleakimage: avwsolutions/memleak:1.0resources:requests:memory: "64Mi"cpu: "250m"limits:memory: "128Mi"cpu: "500m"EOF
After a few minutes, thanks to low memory limits, this pod will get status OOMKilled.
Re-run the PxL script in the UI.
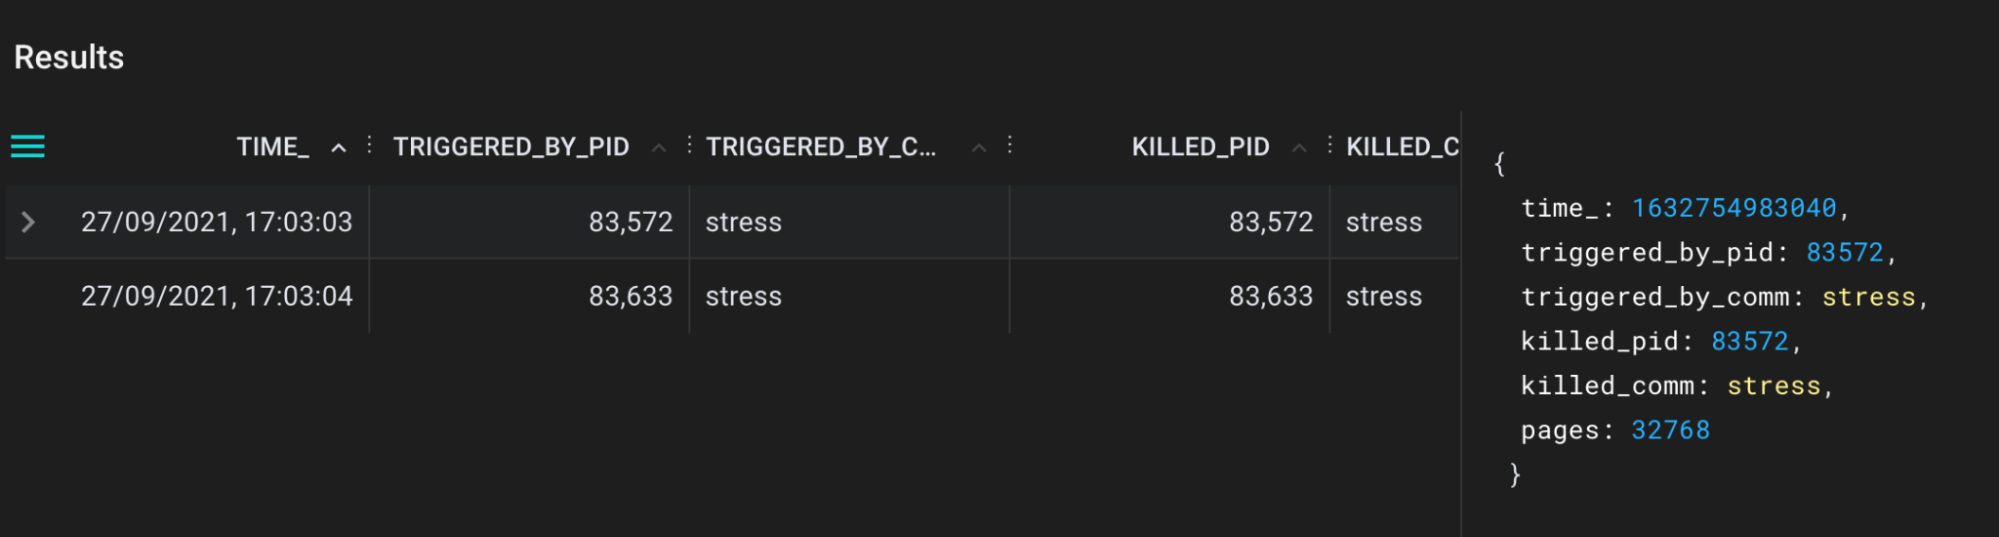
bpftrace/oom_kill.pxl script output in the Pixie UI.
Now we can see exactly which pid is killed, triggered by pid and corresponding names. Cool, isn’t it?!
More bpftrace PxL scripts
To see all of the available scripts, type bpftrace in the script drop-down menu in the Pixie UI. I have contributed the following converted bpftrace programs:
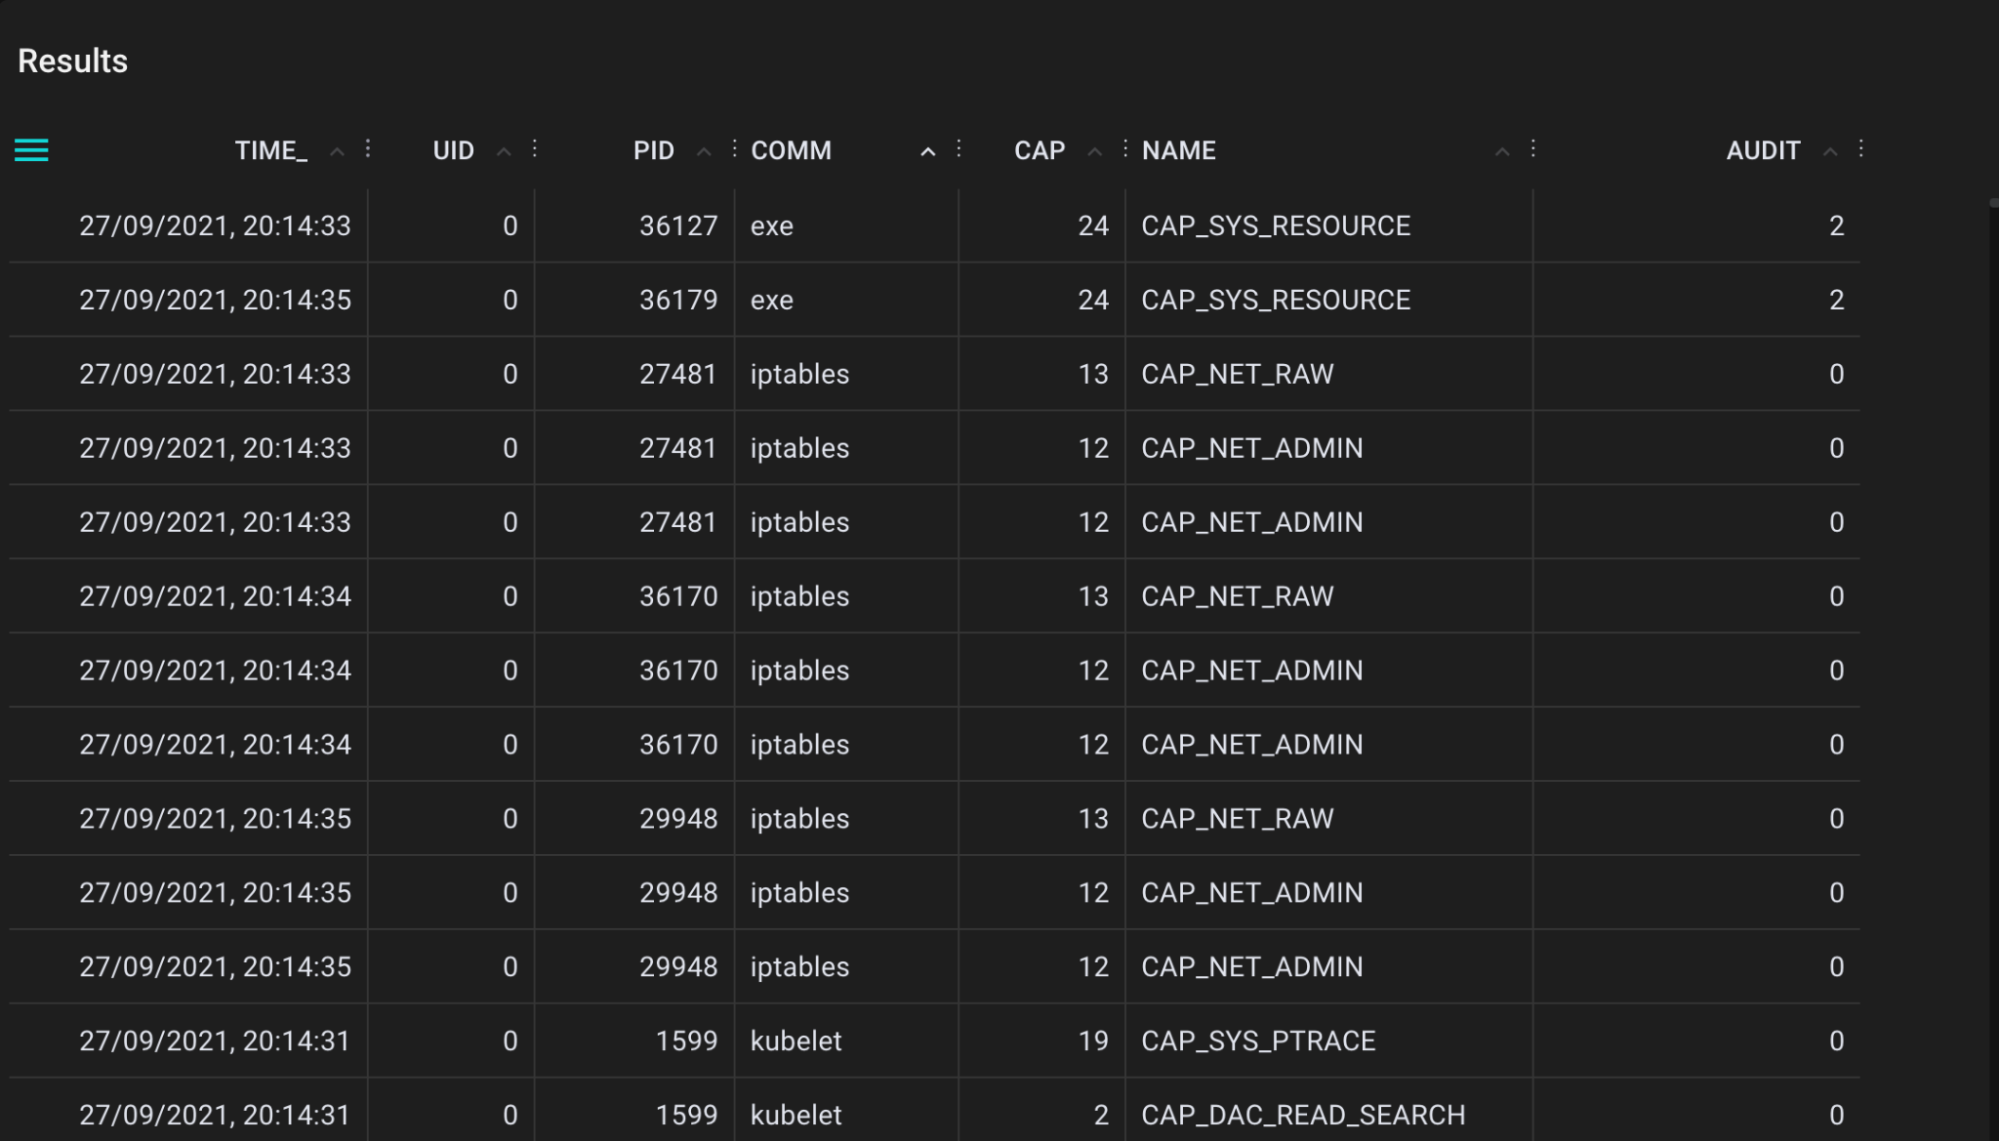
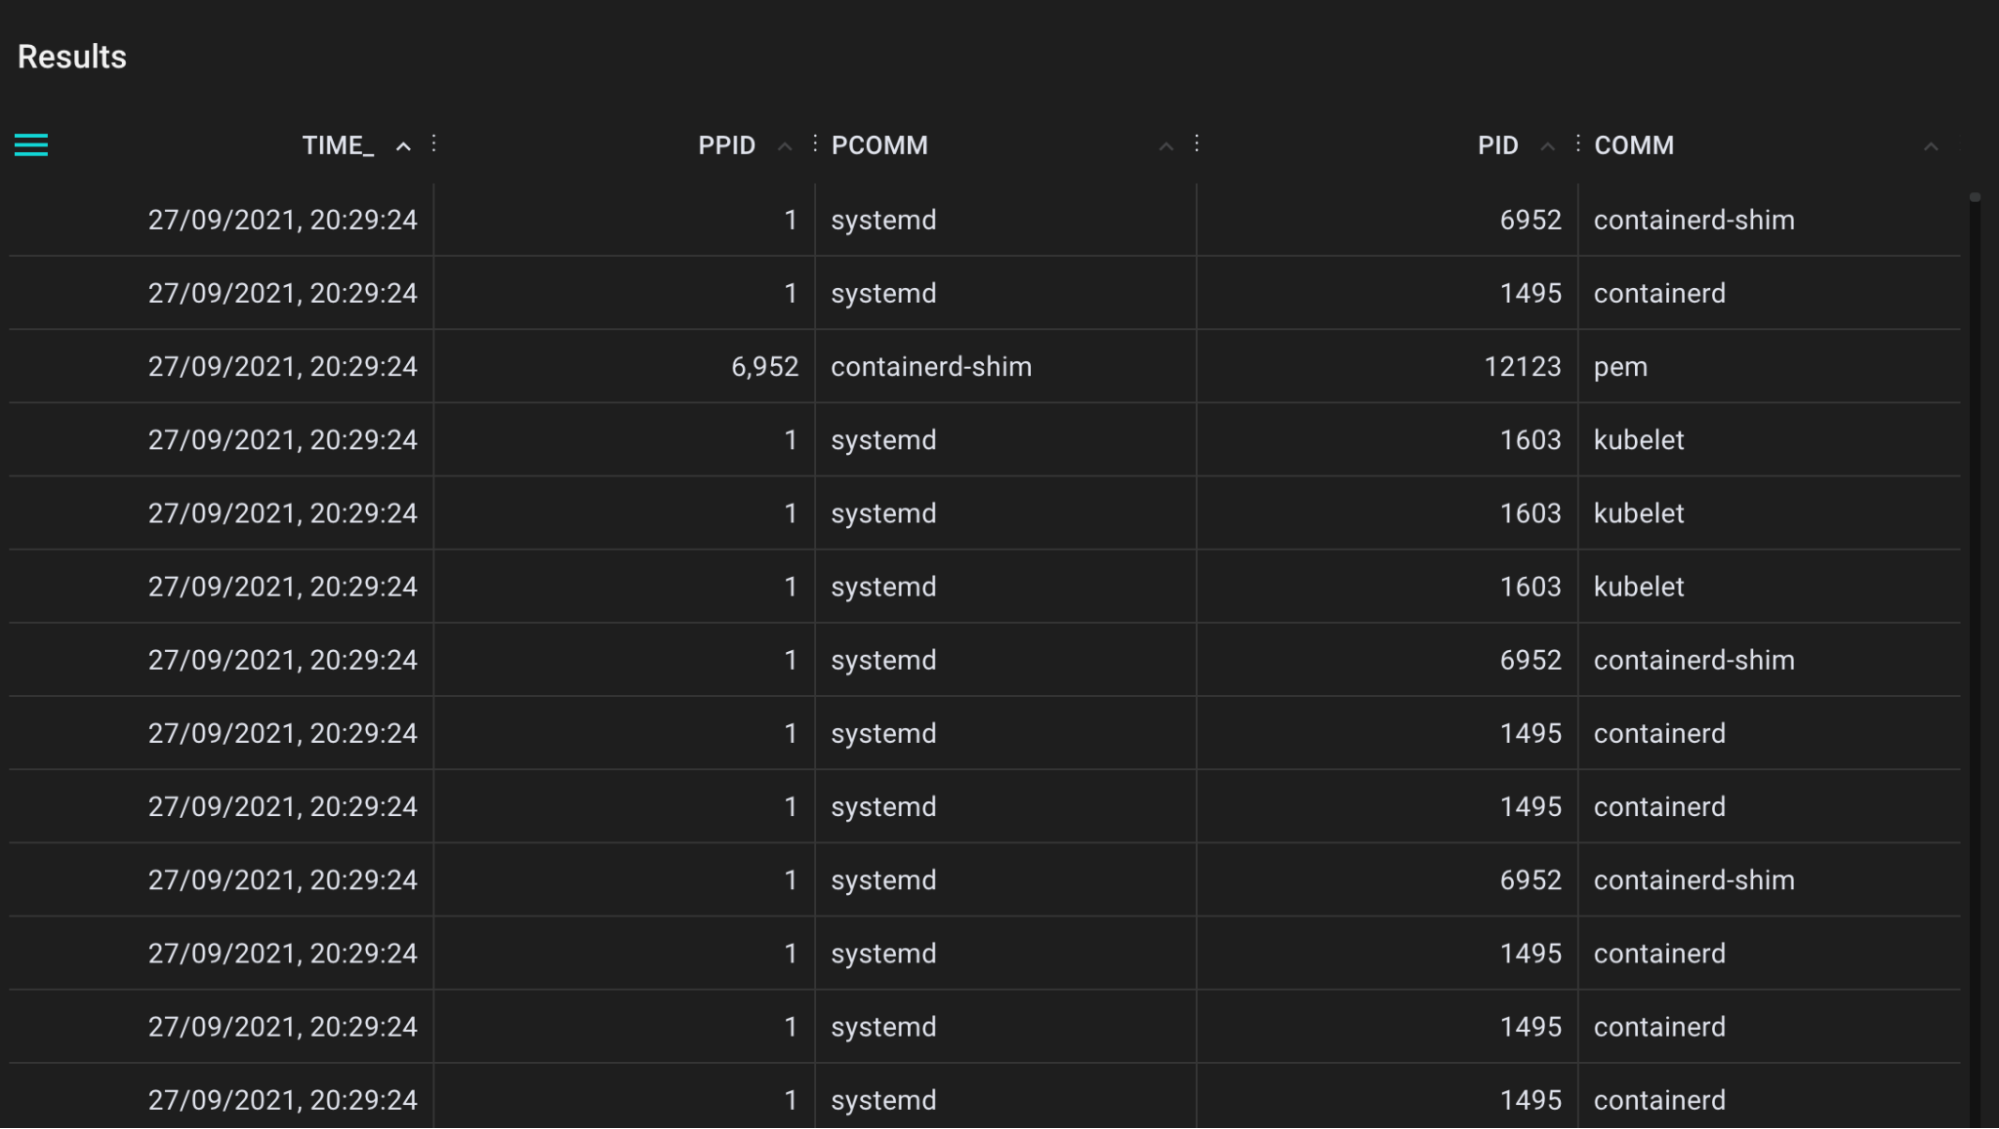
bpftrace/capable
A tool for tracing calls to the kernel cap_capable function. This function is responsible for doing security capability checks and here we record all details for each call to a Pixie table.
.
bpftrace/dc_snoop
A tool for tracing directory entry cache (dcache) lookups. This helps when you are looking for cache hits (references, T=R), but also cache misses (T=M).
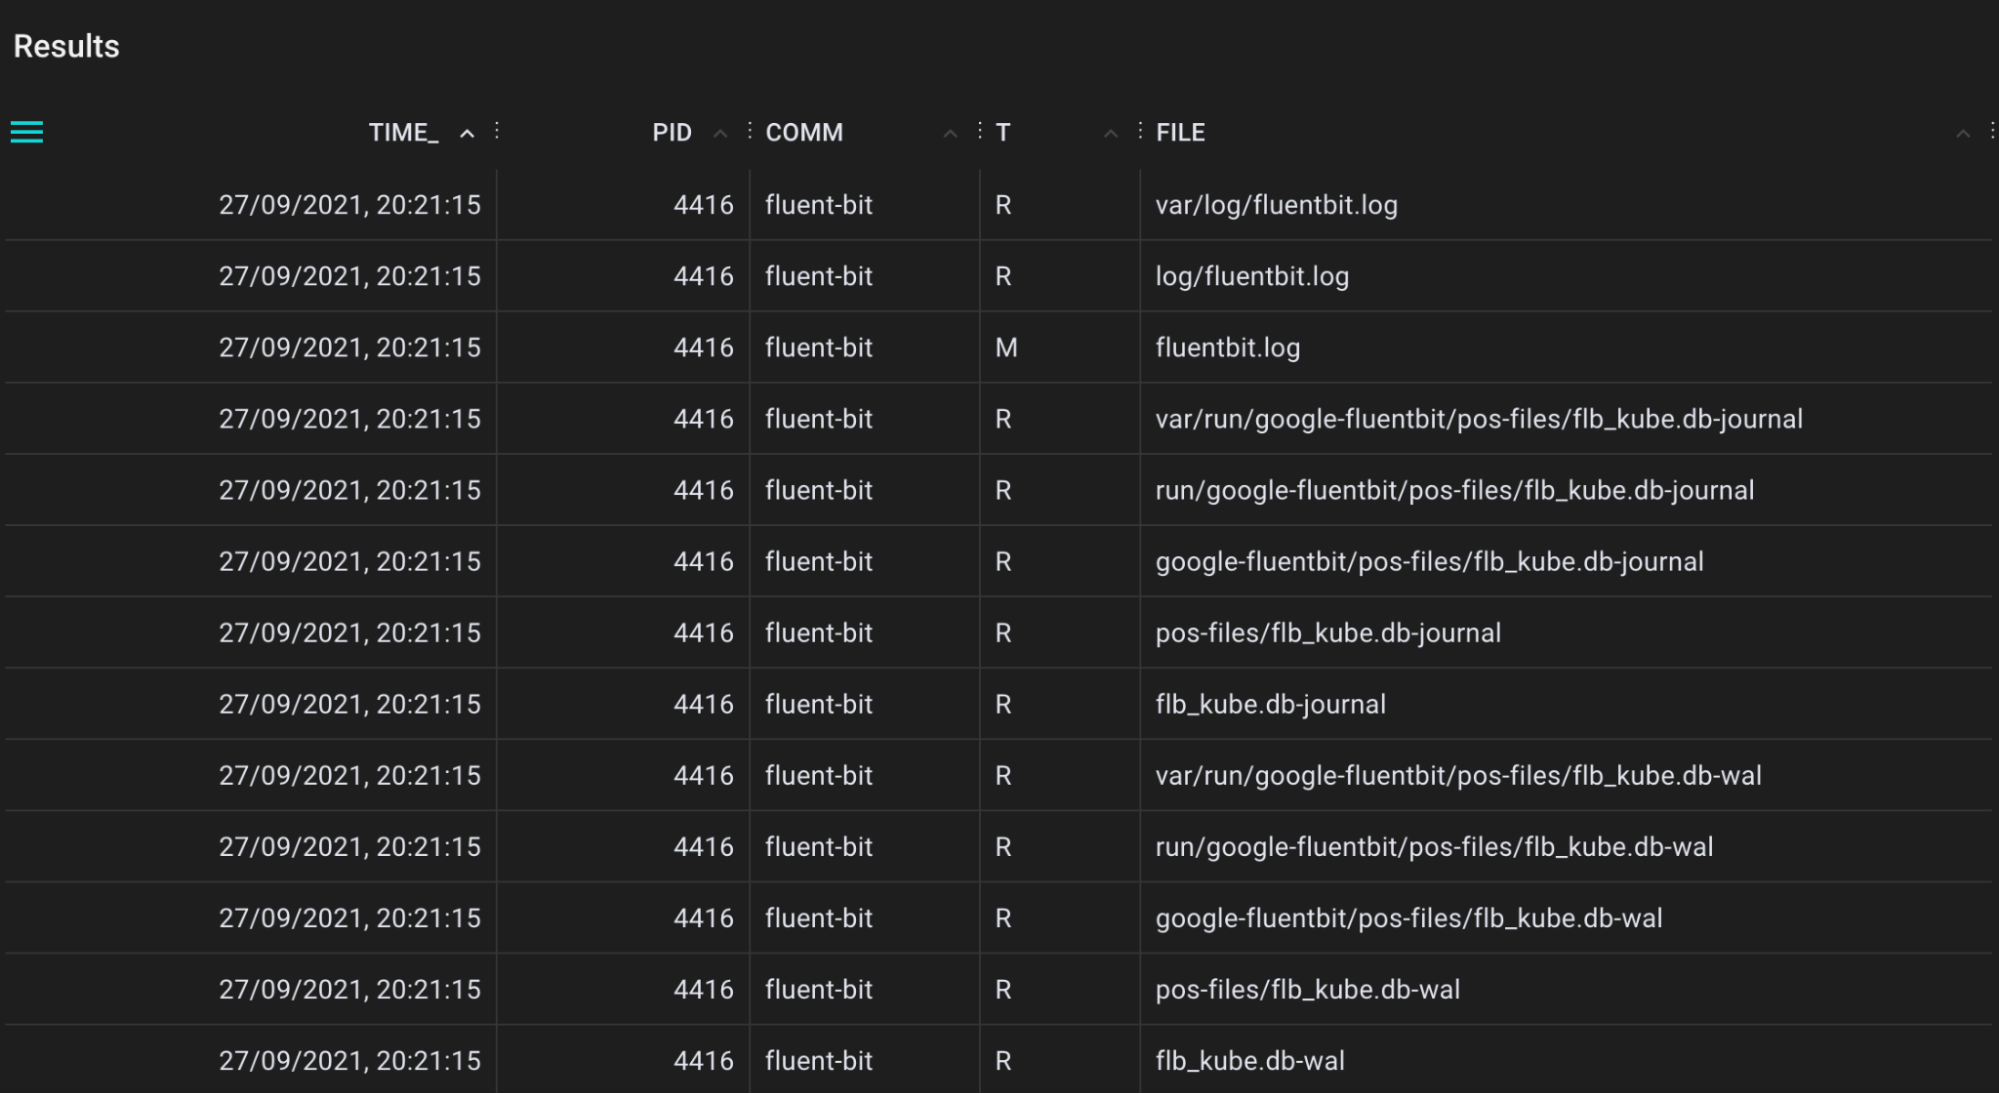
.
bpftrace/nap_time
A tool for tracing application sleeps using the nanosleep syscall.
.
bpftrace/sync_snoop
A tool for tracing filesystem sync events that flushes file system buffers to storage devices.
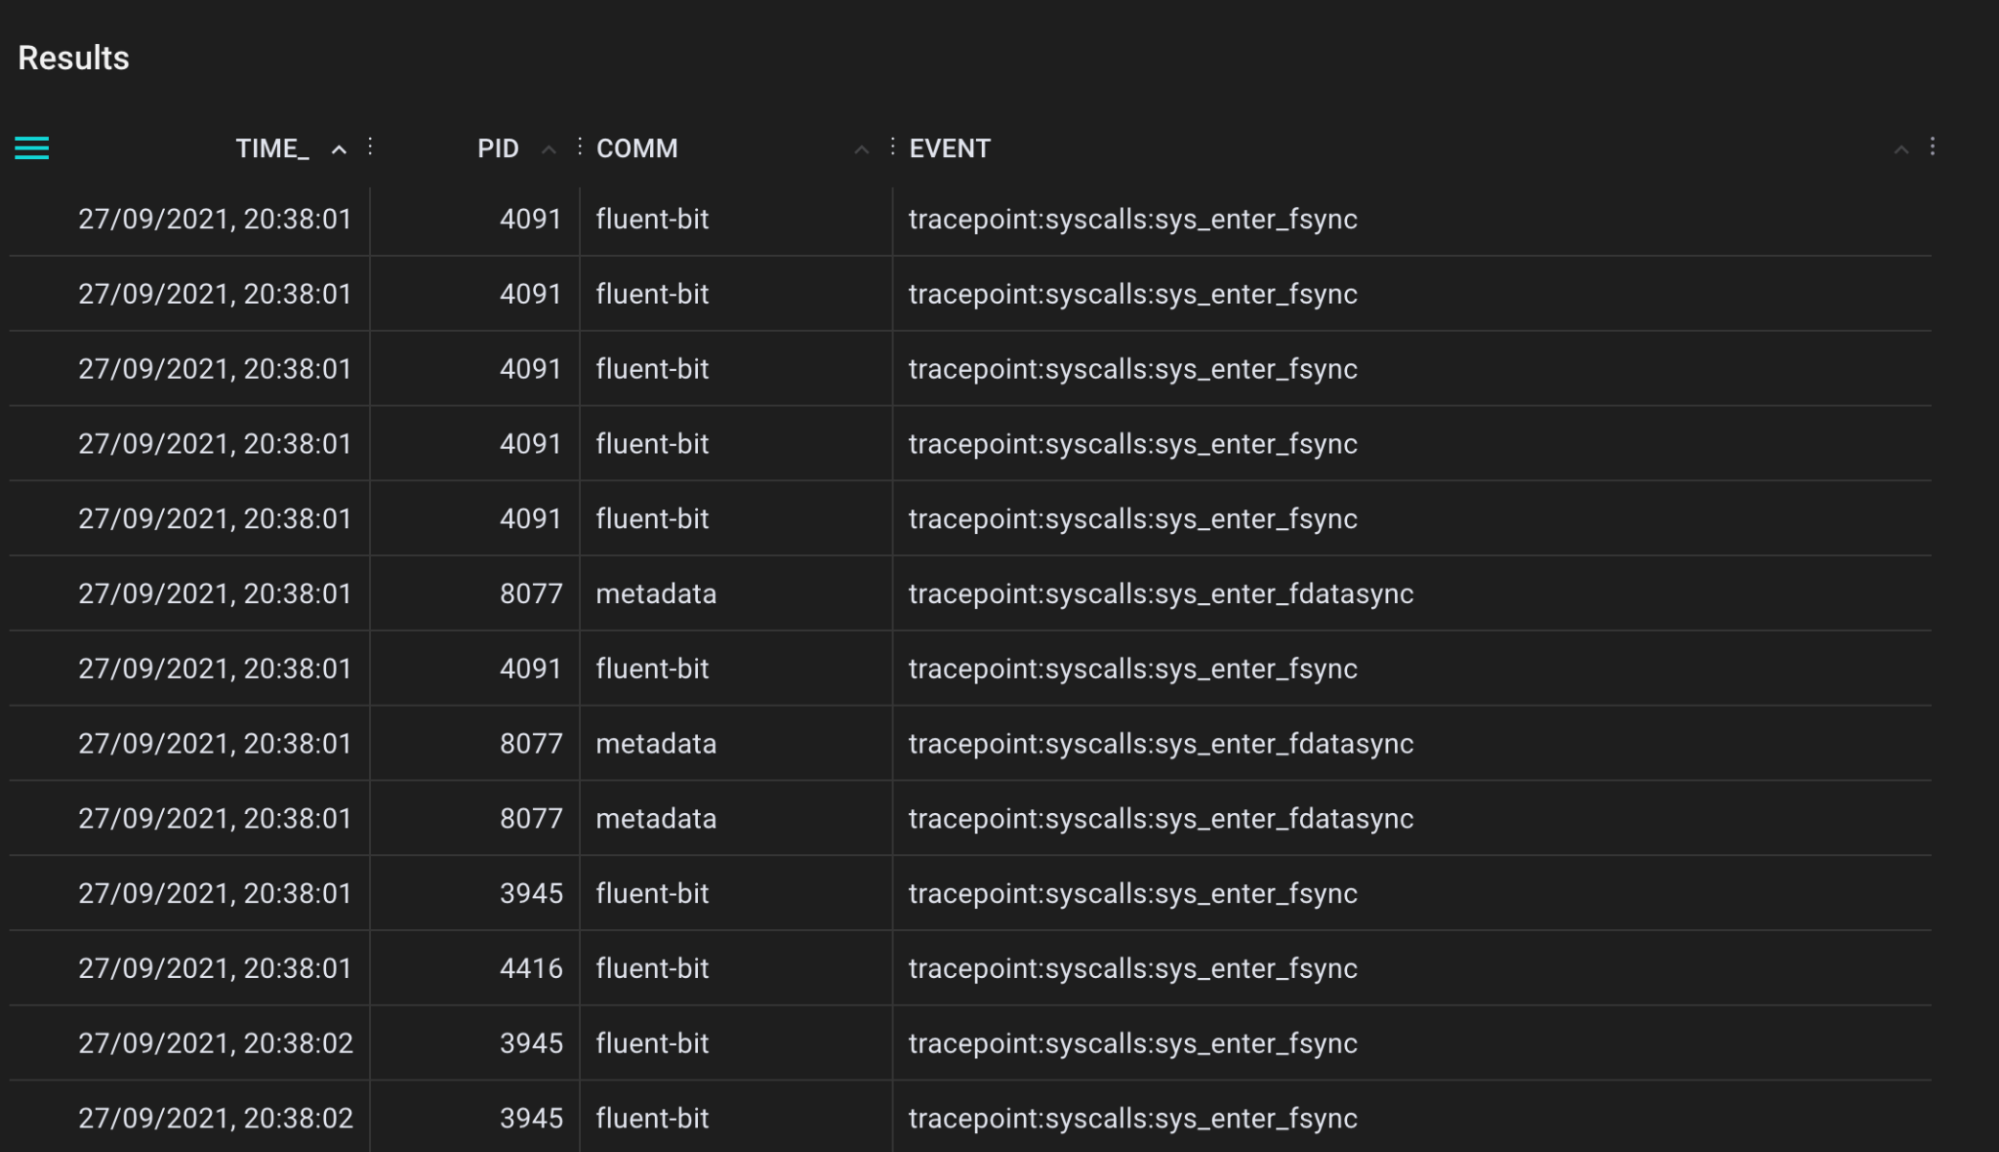
.
bpftrace/tcp_retransmits
A tool for tracing network traffic TCP packages that are retransmitted by the tcp_retransmit() kernel function and showing the actual count and relevant session information. Many retransmits give an indication of bad network connections and helps to diagnose network health.
.
bpftrace/tcp_drops
A tool for tracing network traffic TCP packages that are dropped by the tcp_drop() kernel function and showing the actual count and relevant session information. This helps when you are investigating network performance bottlenecks, when high rate drops are suspected.
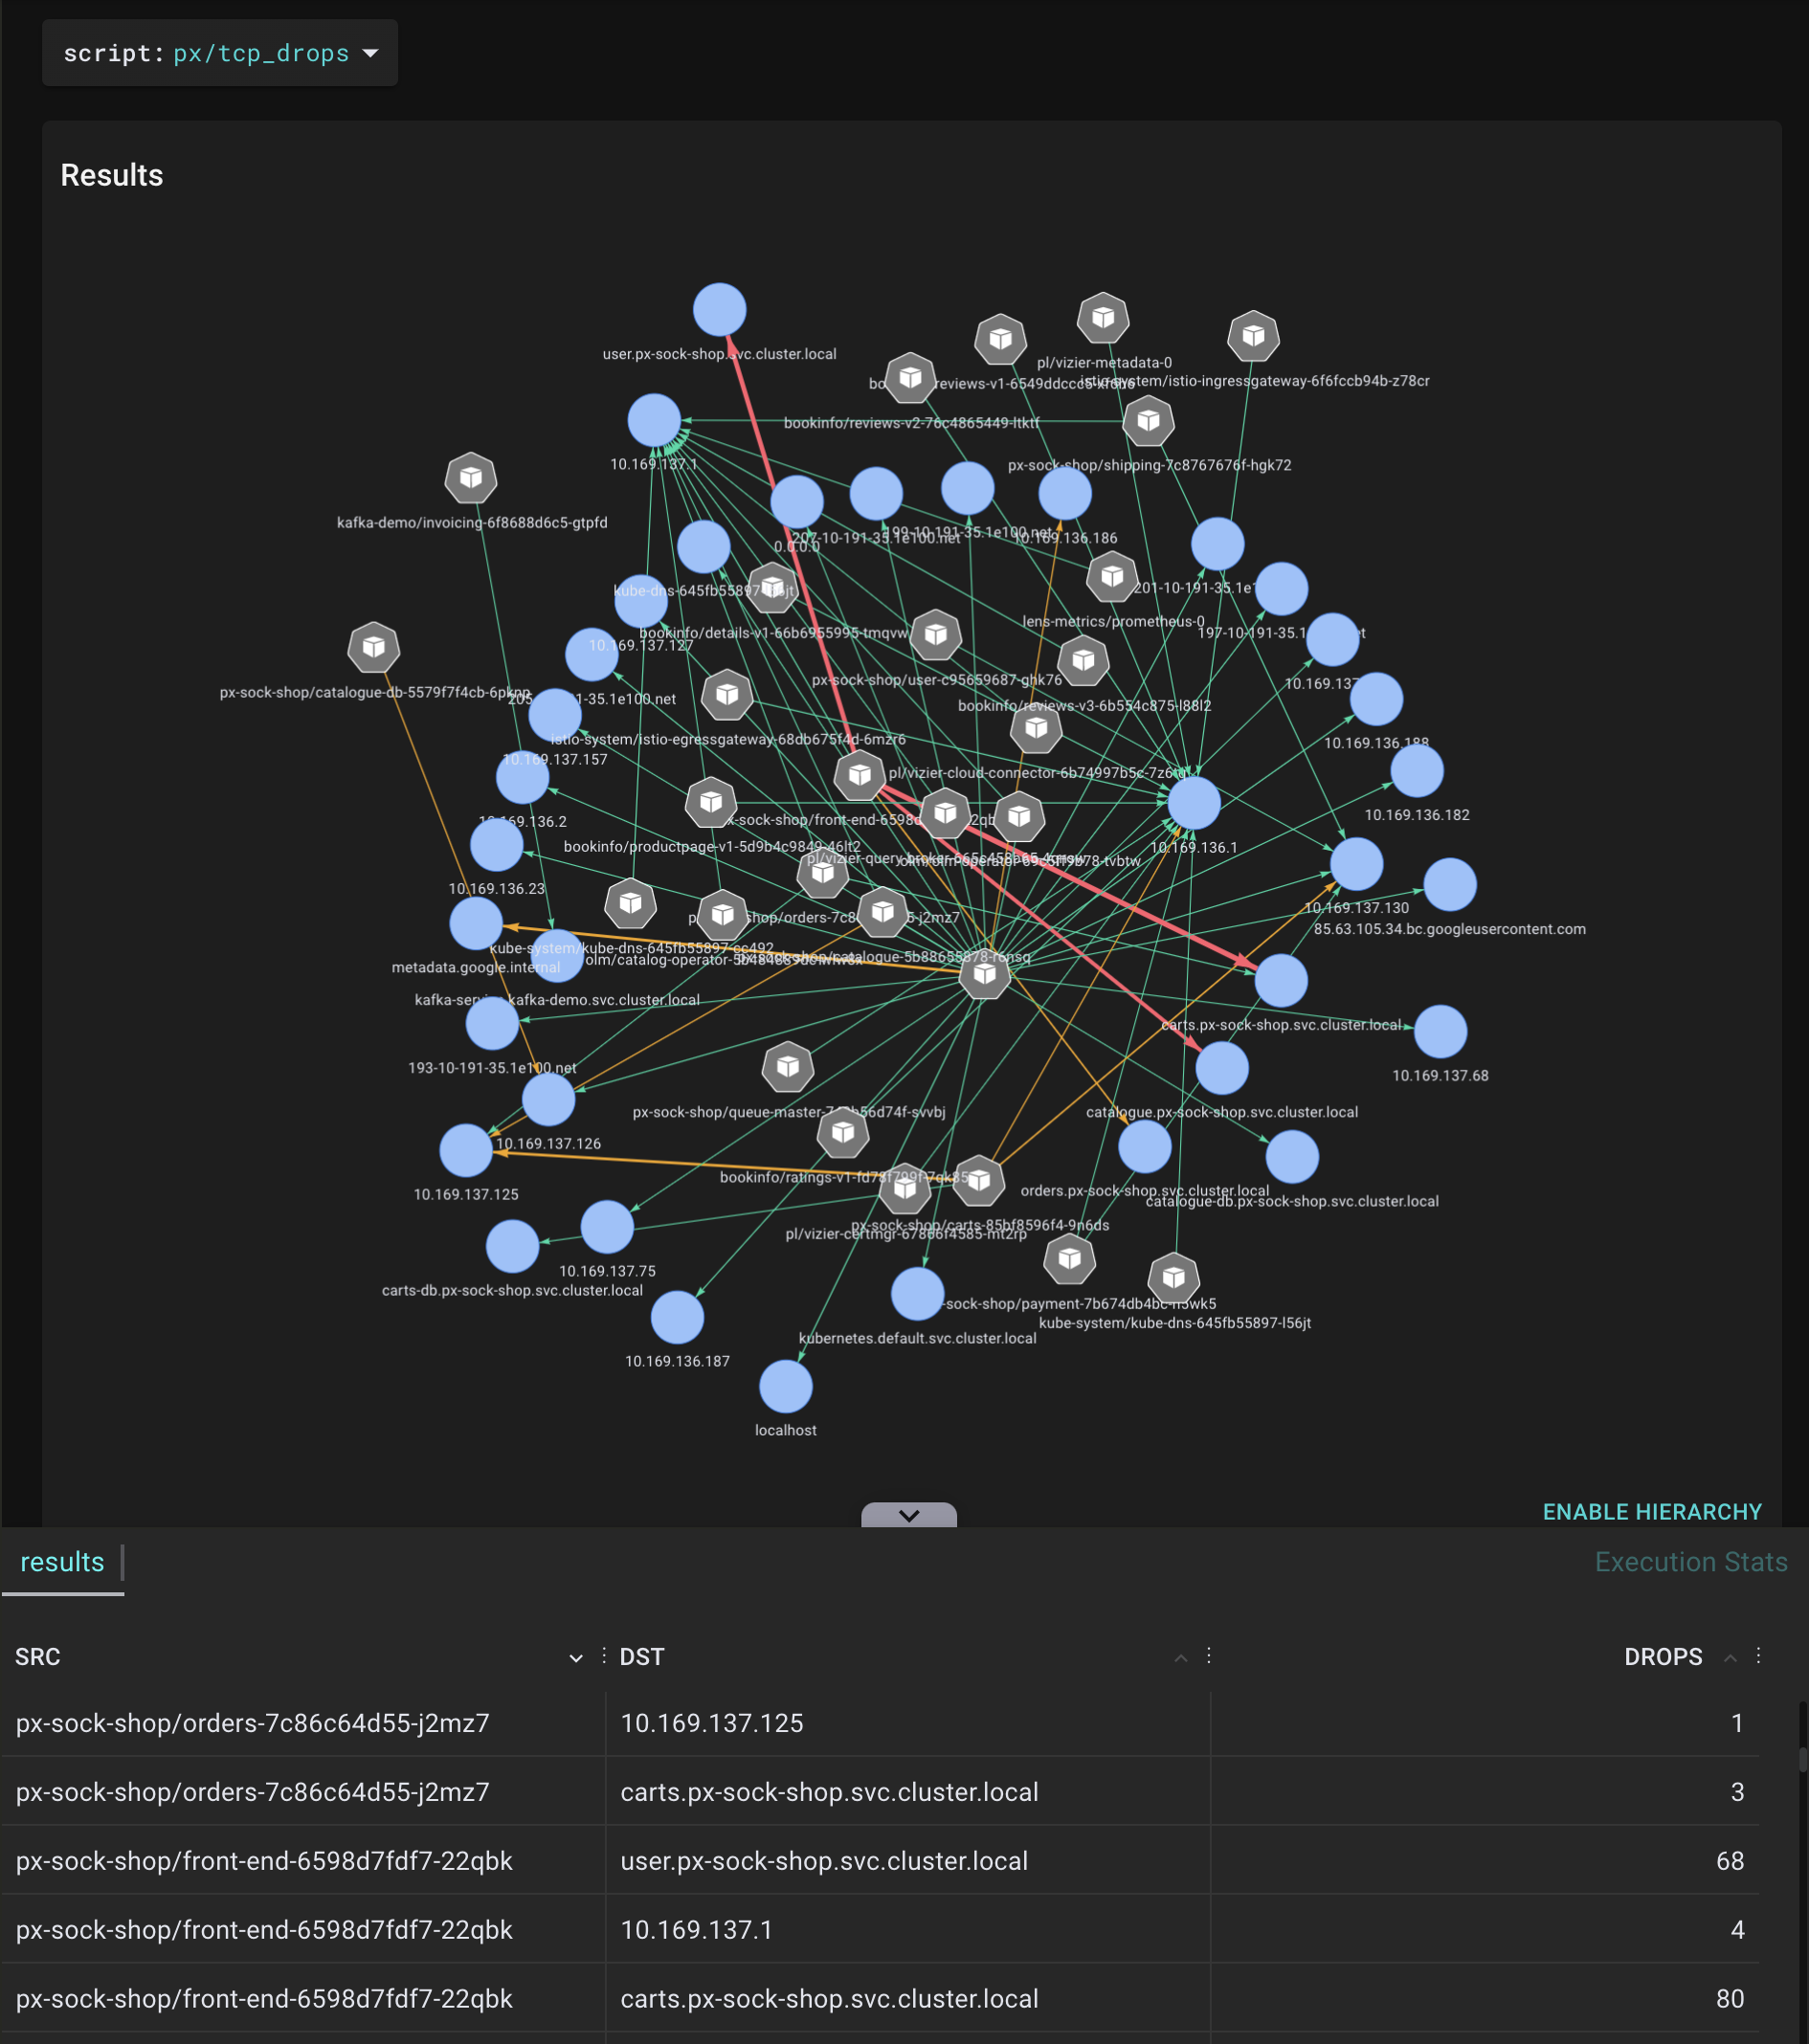
.
Conclusion
Pixie is an application debugging platform that brings eBPF closer to the observability stack. I hope this blog post has demonstrated both the power of eBPF and how easy it is to use Pixie to deploy BPF programs to all of the nodes in your cluster. Be sure to check out all of the existing bpftrace scripts available in Pixie and the experimental ones coming soon.
We also saw the limitations of this feature. Currently, only KProbes are supported and some documentation is still a work-in-progress. Hopefully this blog post helps with the documentation part and also energizes engineers or developers to try out Pixie. It would be great for the community to build more great and helpful PxL scripts.
We close this blog with a big shoutout to Brendan Gregg and the eBPF community for creating these awesome bpftrace tools. Lastly, I want to thank Omid Azizi from Pixie for his community belief and helping me out when creating these scripts.
Resources
- "Distributed bpftrace Deployment with Pixie" tutorial.
Questions? Find us on Slack or Twitter at @pixie_run.
Related posts


Terms of Service|Privacy Policy
We are a Cloud Native Computing Foundation sandbox project.

Pixie was originally created and contributed by New Relic, Inc.
Copyright © 2018 - The Pixie Authors. All Rights Reserved. | Content distributed under CC BY 4.0.
The Linux Foundation has registered trademarks and uses trademarks. For a list of trademarks of The Linux Foundation, please see our Trademark Usage Page.
Pixie was originally created and contributed by New Relic, Inc.
This site uses cookies to provide you with a better user experience. By using Pixie, you consent to our use of cookies.