Export Pixie data in the OpenTelemetry format.Learn more🚀
Pixie has an OpenTelemetry plugin!
Ctrl/Cmd + K
How we automated Java profiling: in production, without re-deploy

Pete Stevenson
September 22, 2022 • 6 minutes readPrincipal Engineer @ New Relic, Founding Engineer @ Pixie Labs
The Java ecosystem offers many options for profiling Java applications, but what if you want to debug on prod without redeploying?
At Pixie, we’re building an open source platform that makes Kubernetes observability ridiculously easy for developers. Our guiding principles is that you shouldn’t have to instrument, recompile or redeploy your applications in order to observe and debug them.
Adding Java support to our continuous always-on profiler was no exception; it needed to work out-of-the box, without recompilation or redeployment. But Java’s Just-In-Time compilation makes it challenging to convert captured stack-traces — containing virtual addresses of running processes — into human readable symbols.
This blog post will describe how our eBPF-based profiling and Java symbolization works under the covers and include some of the insights that we acquired as we built out this feature.
How our eBPF-based always-on profiler works
The Pixie performance profiler uses an eBPF program running in the kernel to periodically sample stack-traces from the running applications. A stack-trace shows a program’s state, i.e. its call stack, at a particular moment in time. By aggregating across many stack trace samples, one can see which portions of a program’s call stack are using the CPU the most.
When the kernel samples a stack trace, it is a list of instruction pointers in the virtual address space of the relevant process. Symbolization is the task of translating those virtual addresses into human readable symbols, e.g. translating address 0x1234abcd into symbol foo(). After moving the stack-traces from their BPF table to our user-space “Pixie edge module,” the stack-traces are then symbolized. Because the stack-traces are sampled by the kernel, they include all running processes -- naturally, including Java.
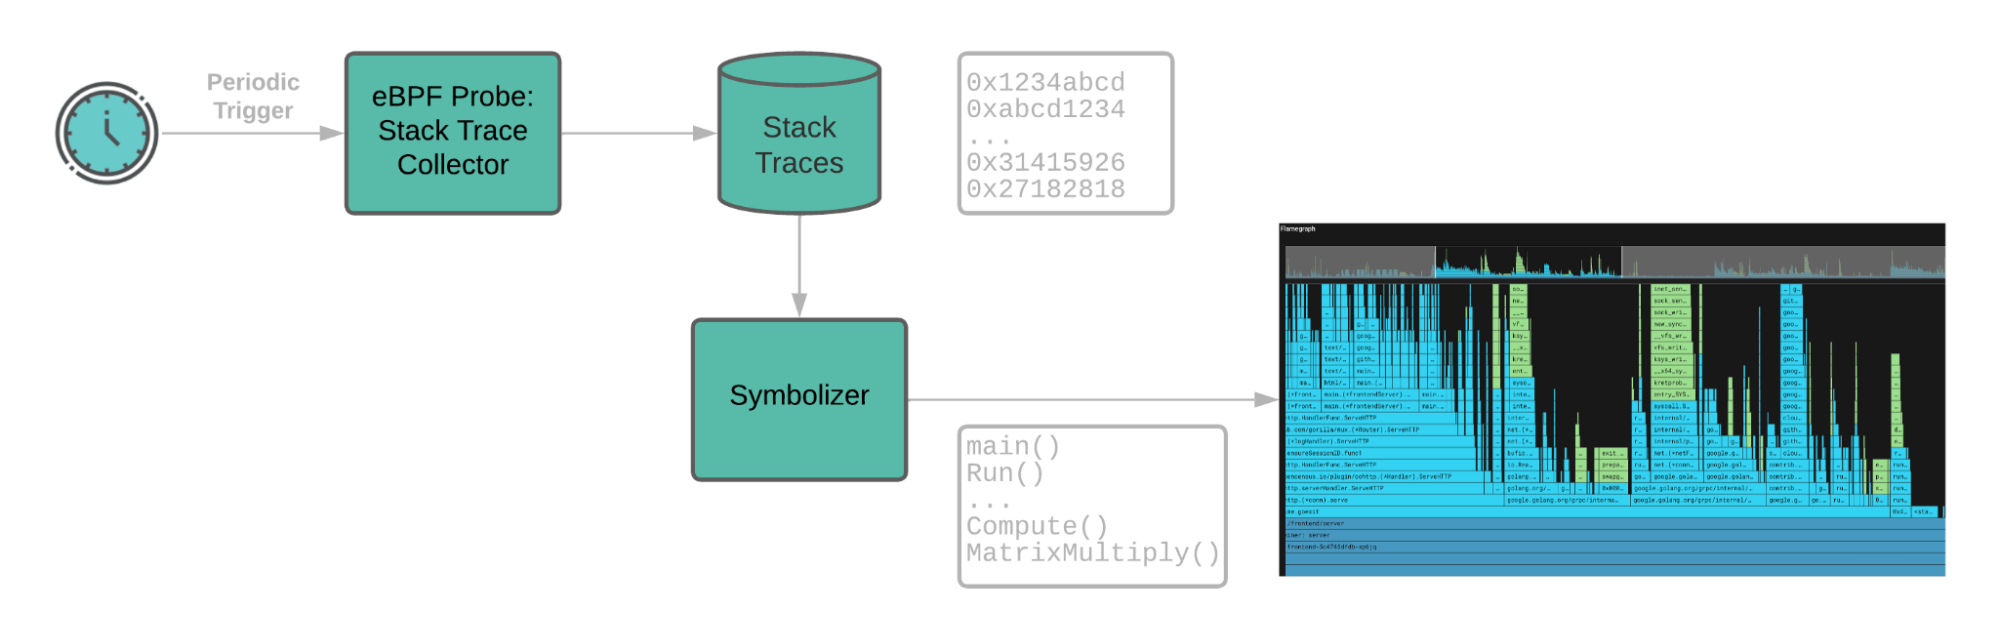
Pixie’s continuous profiler uses eBPF to sample stack-traces. The stack-trace tables are then pushed to the user space where they are symbolized.
For Java processes, the addresses collected by the stack trace sampler represent the underlying Java application source code that has been JIT’d into native machine code by the JVM 1, but symbolization is not straightforward.
Symbolizers for compiled languages that are not JITed (e.g. C++, Golang) work by finding the debug symbol section in natively compiled binaries and libraries. However this is not available for Java byte code, since the code is not statically mapped into the application's virtual address space. Thus, our original symbolizer could not make sense out of a Java stack-traces (except for parts that are explicitly in the JVM, but these are not usually of interest to application developers).
To make Java profiling “work,” we needed a new symbolizer. Fortunately, we were able to lean on other open source contributions and the Java ecosystem to easily meet this need. In brief, we use the Java Virtual Machine Tool Interface -- the “JVMTI” -- to interact with the JVM running the target Java application. Based on the open source Java “perf map agent”, we wrote our own JVMTI agent that listens to the JVMTI callbacks for CompiledMethodLoad and DynamicCodeGenerated 2. Thus, our JVMTI agent writes each Java symbol and its corresponding address range into a symbol file, and by reading this file, the Pixie data collection process (the Pixie Edge Module or “pem”) symbolizes Java stack-traces.
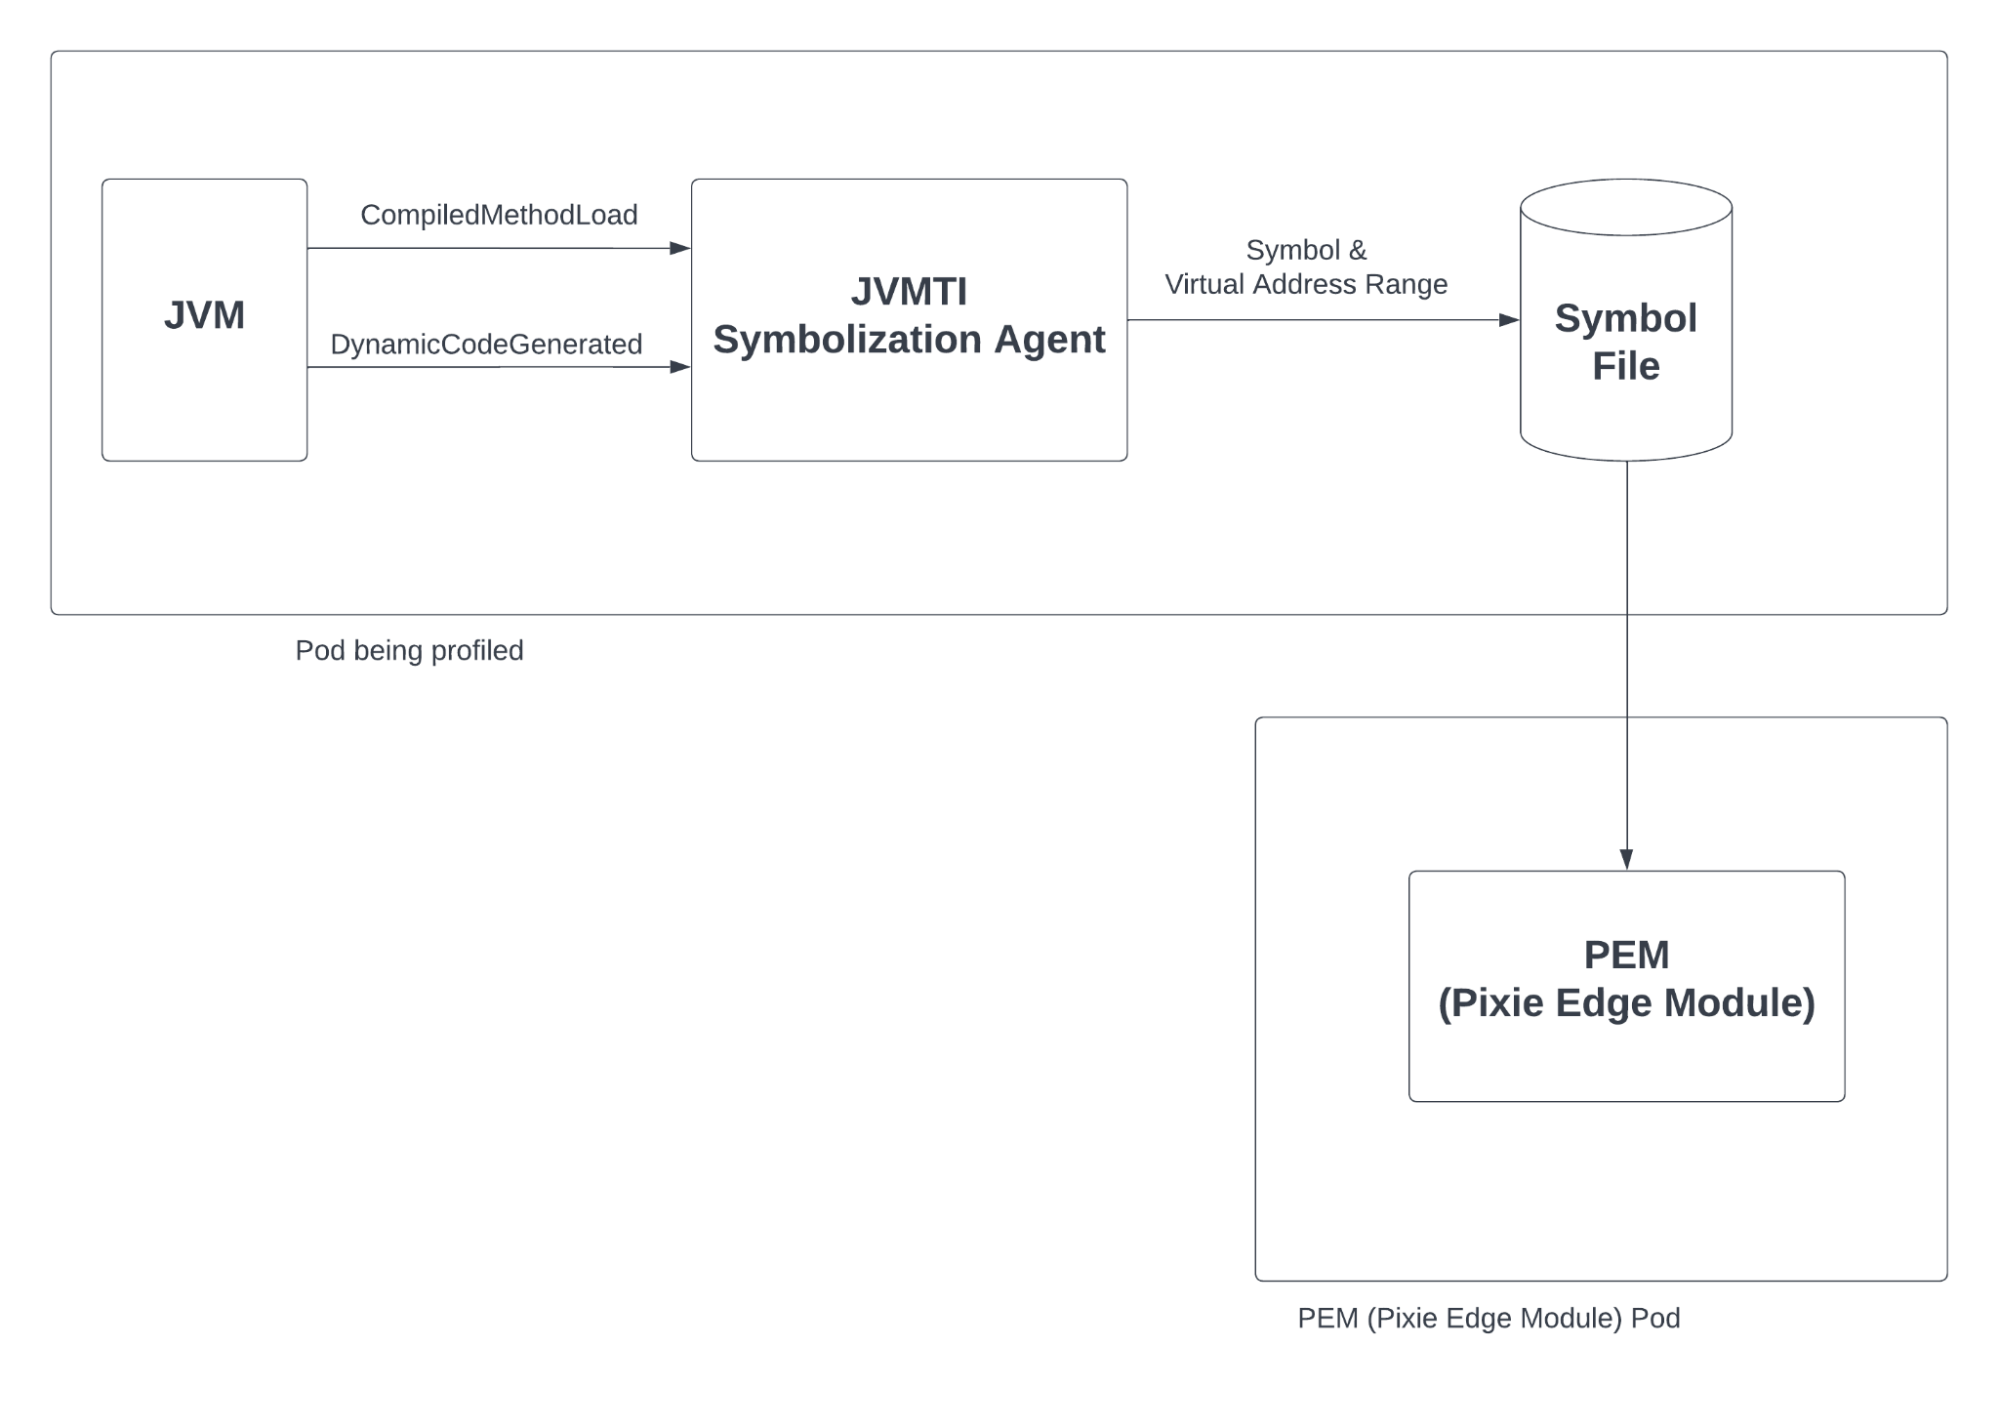
Using a JVMTI agent to extract symbols from JIT’d code in the Java Virtual Machine.
JVMTI attach issues in a Kubernetes context
To match an address in a stack-trace to a symbol in the underlying application source code, Pixie uses a JVMTI agent. The agent is triggered each time the JVM JITs some application source code into native binary code stored in memory, and it simply writes the symbol and its corresponding virtual address range into a symbol file. But, Pixie promises turn-key automation, so how do we automatically attach a JVMTI agent to a target application process in a Kubernetes cluster?
Agent attach is well supported by the Java ecosystem. The easiest way to accomplish it is through a command line argument passed to the Java binary at application startup, e.g.:
java -agentpath:/path/to/agent.so <other java args>

However, this method requires an application restart which violates our no-redeployment philosophy.
Fortunately, Java provides a way to dynamically attach JVMTI agents after application startup. One can simply write another Java program, and invoke the attach API:
VirtualMachine vm = VirtualMachine.attach(targetProcessPID);vm.load(agentFilePath);
So... either you need your own Java binary (which introduces worries about version and protocol matching) or you can try to use the Java binary in the target container, which may fail if that Java binary does not include the necessary virtual machine libraries.
But this assumes you can easily access a Java binary compatible with your target process and in the same container namespaces. It would be neat if we could just do whatever the above code snippet does, and it turns out, that is entirely possible: the mechanics of dynamic agent attach require just a little bit of interprocess communication over a Unix domain socket. But, this is where things get a little complicated thanks to Kubernetes and the diversity of application containers.
To automatically attach a JVMTI agent to a Java process running as a peer in Kubernetes, one needs to be aware of the following issues:
- Different JVM implementations (HotSpot and OpenJ9) have different attach protocols.
- The agent
.sofile needs to be visible from inside of the target application container. - The Unix domain socket may need to share the same UID & GID as the target process.
- Different libc implementations (Alpine Linux uses musl, not glibc).
In more detail, the two prevailing JVM implementations, HotSpot and OpenJ9, have slightly different attach protocols. In each case, a Unix domain socket is created and used to pass messages into the JVM, but the location of the socket file and the specific message protocol differ. In general, it helps to be aware that the target process is fundamentally unaware of the fact that it is running in a container. So, for example, to start the HotSpot attach protocol, one creates a sentinel file and sends SIGQUIT to the target Java process. The sentinel file is, by convention, named /tmp/.attach_pid<PID>. The value for <PID> needs to be found in the PID namespace of the target container, otherwise, the target process assumes it is for a different JVM.
After notifying the JVM of the attach request and opening a socket to communicate with the JVM, the JVM process needs to be able to find the .so file that contains your JVMTI agent, i.e. so that it can map in the library using dlopen and then invoke the JVMTI method Agent_OnAttach(). For this, the agent .so file needs to be visible inside of the target container’s mount namespace. The upshot of this is simple: we copy our agent library into the target container before starting the attach protocol3.
Depending on the underlying JVM (HotSpot or OpenJ9) and Java version, the process executing the agent attach protocol may need to assume the UID and GID of the target JVM. For older JVMs running as non-root (a best practice), even a process running as root would have the attach sequence rejected. For OpenJDK/HotSpot v11.0.1 or greater, root is allowed to invoke the attach sequence.
Knowing all of the above, one might reasonably expect success -- that is, unless the target Java process is running on an Alpine Linux base image which uses musl instead of glibc. To account for the prevalent use of Alpine Linux (and thus musl), the Pixie Java profiler supplies two agent libraries: one built with musl and one with glibc.
How we automated agent attach
We need to be aware of several facts: the target process is in a peer container, the attach protocol differs by JVM, and the underlying container may have either glibc or musl. After discovering a few of the above issues “the hard way,” we found an excellent open source contribution, namely jattach, which inherently handles most of this complexity. The jattach binary inherently handles both the HotSpot and OpenJ9 attach protocols, and it handles most of the container related issues (e.g. chowning to the correct UID & GID). Succinctly, jattach is highly useful and stands out as an excellent open source contribution.
Unfortunately, we still needed a small amount of additional functionality beyond what jattach provides. For this, we created our own attach program, named px_jattach in honor of its primary ancestor. The px_jattach program first copies both our glibc and musl agent libraries into the target container and then it selects one to use by attempting to map them in using dlopen. After selecting the appropriate agent library, px_jattach simply invokes jattach to do the remaining heavy lifting.
Conclusion
Pixie’s open source platform enables automated turn-key observability for both protocol tracing and performance profiling. With the addition of Java symbolization, Pixie supports full system mixed mode performance profiling of Java applications with low enough overhead to be enabled continuously in production.
To enable Java support without redeployment, we needed to add a JVMTI agent. Each time the JVM JITs some application source code into native binary code stored in memory, our agent writes the symbols and their corresponding virtual address range into a symbol file that we can use to symbolize the Java stack traces.
To see Pixie’s continuous profiler in action, check out the tutorial!
To learn more about how we built Pixie’s continuous eBPF-based profiler, read the Building a Continuous Profiler series.
Have questions? Need help? Find us on Slack or Twitter.
Footnotes
- This is in contrast to interpreted languages where the addresses in a stack-trace represent code in the language interpreter (e.g. in the Python or Ruby binary), not in the application source code.↩
- Our JVMTI agent also responds to the
CompiledMethodUnloadcallback. When a method is unloaded, we invalidate the mapping from virtual address range to symbol.↩ - Actually, we copy both our
libc&muslagent libraries, and we chown them to the UID & GID of the target process.↩
Related posts


Terms of Service|Privacy Policy
We are a Cloud Native Computing Foundation sandbox project.

Pixie was originally created and contributed by New Relic, Inc.
Copyright © 2018 - The Pixie Authors. All Rights Reserved. | Content distributed under CC BY 4.0.
The Linux Foundation has registered trademarks and uses trademarks. For a list of trademarks of The Linux Foundation, please see our Trademark Usage Page.
Pixie was originally created and contributed by New Relic, Inc.
This site uses cookies to provide you with a better user experience. By using Pixie, you consent to our use of cookies.