Deploying new code to your production cluster can be stressful. No matter how well the code has been tested, there’s always a risk that an issue won’t surface until exposed to real customer traffic. To minimize any potential impact on your customers, you’ll want to maintain tight control over the progression of your application updates.
The native Kubernetes Deployment supports two strategies for replacing old pods with new ones:
Recreate: version A is terminated then version B is rolled out. Results in downtime between shutdown and reboot of the application.RollingUpdate(default): version B is slowly rolled out replacing version A.
Unfortunately, neither provides much control. Once a RollingUpdate is in progress, you have little control over the speed of the rollout or the split of the traffic between version A and B. If an issue is discovered, you can halt the progression, but automated rollbacks are not supported. Due to these limitations, RollingUpdate is generally considered too risky for large scale production environments.
In this post, we’ll discuss how a canary deployment strategy can reduce risk and give you more control during application updates. We’ll walk through how to perform a canary deployment with Argo Rollouts including automated analysis of the canary pods to determine whether to promote or rollback a new application version. As an example, we’ll use Pixie, an open source Kubernetes observability tool, to generate HTTP error rate for the canary pods.
The source code and instructions for this example live here.
A canary deployment involves directing a small amount of traffic to the updated version of a service that has been deployed alongside the stable production version. This strategy allows you to verify that the new code works in production before rolling out the change to the rest of your pods.
The typical flow for a canary deployment looks something like this:
- Run the existing stable version of the service alongside the new canary version of the service in the production K8s cluster.
- Split and scale traffic between the two versions.
- Analyze how the canary version is performing.
- Based on the results of the canary analysis either replace the stable version with the newer canary version or rollback to the stable version.
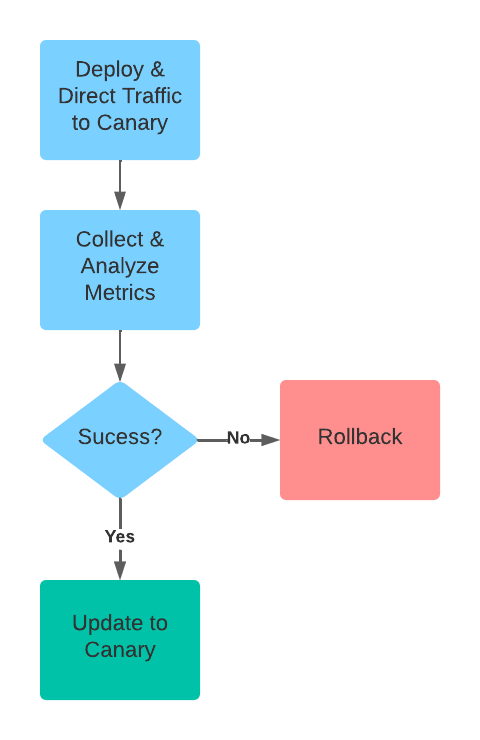
A canary deployment strategy reduces risk by diverting a small amount of traffic to the new version. Metrics from the canary release inform the decision to increase traffic or rollback.
A canary release doesn’t guarantee that you will identify all issues with your new application version. However, a carefully designed canary configuration can maximize your chance of catching an issue before the new version is fully rolled out.
Too little traffic can make it harder to detect problems, but too much traffic will impact more users in the event that an issue is discovered with the canary release. As a general rule, aim to direct 5-10% of your traffic to the canary release. If possible, you should time your canary deploys to overlap with your peak traffic period.
There’s no correct answer to this question, but you’re trading off better data with reduced development velocity. One strategy is to implement a short first step (e.g. 5 min) so that you can fail fast for any obvious issues, with longer steps to follow if the first step succeeds. Analysis should also be tailored per service so that critical services are monitored for longer periods of time.
For API based services it is common to measure the following metrics:
- Error Rate: the percentage of 4xx+ responses
- Latency: the length of time between when the service receives a request and when it returns a response.
- Throughput: how many requests a service is handling per second
However, these metrics may differ depending on the specific profile of your service.
You can manually perform a canary deployment using native Kubernetes, but the benefit of using Argo Rollouts is that the controller manages these steps for you. Another advantage of Argo is that it supports traffic splitting without using a mesh provider.
Argo Rollouts is a Kubernetes controller and set of CRDs, including the
Rolloutresource: a drop-in replacement for the native Kubernetes Deployment resource. Contains the recipe for splitting traffic and performing analysis on the canary version.AnalysisTemplateresource: contains instructions on which metrics to query and defines the success criteria for the analysis.
The combination of these two CRDs provide the configurability needed to give you fine grained control over the speed of the rollout, the split of the traffic between the old and new application versions, and the analysis performed on the new canary version.
The Rollout resource defines how to perform the canary deployment.
Our rollout-with-analysis template (shown below) does the following:
- Runs background analysis to check the canary pod’s HTTP error rate every 30 seconds during deployment. If the error rate exceeds the value defined in the AnalysisTemplate, the Rollout should fail immediately.
- At first, only 10% of application traffic is redirected to the canary. This value is scaled up to 50% in the second step. Each step has a 60 second pause to give the analysis time to gather multiple values.
Note that this canary rollout configuration does not respect the best practices laid out in the beginning of this article. Instead, the values are chosen to allow for a quick 2 min demo.
apiVersion: argoproj.io/v1alpha1kind: Rolloutmetadata:name: canary-demospec:replicas: 5revisionHistoryLimit: 1selector:matchLabels:app: canary-demostrategy:canary:analysis:templates:- templateName: http-error-rate-backgroundargs:- name: namespacevalue: default- name: service-namevalue: canary-demo- name: canary-pod-hashvalueFrom:podTemplateHashValue: LatestcanaryService: canary-demo-previewsteps:- setWeight: 10- pause: {duration: 60s}- setWeight: 50- pause: {duration: 60s}
The AnalysisTemplate defines how to perform the canary analysis and how to interpret if the resulting metric is acceptable.
Argo Rollouts provides several ways to perform analysis of a canary deployment:
- Query an observability provider (Prometheus, New Relic, etc)
- Run a Kubernetes Job
- Make an HTTP request to some service
Querying an observability provider is the most common strategy and straightforward to set up. We’ll take a look at one of the less documented options: we’ll spin up our own metrics server service which will return a metric in response to an HTTP request.
Our metric server will use Pixie to generate a wide range of custom metrics. However, the approach detailed below can be used for any metrics provider you have, not just Pixie.
The http-error-rate-background template (shown below) checks the HTTP error rate percentage every 30 seconds (after an initial 30s delay). This template is used as a fail-fast mechanism and runs throughout the rollout.
apiVersion: argoproj.io/v1alpha1kind: AnalysisTemplatemetadata:name: http-error-rate-backgroundspec:args:- name: service-name- name: namespace- name: canary-pod-hashmetrics:- name: webmetricsuccessCondition: result <= 0.1interval: 30sinitialDelay: 30sprovider:web:url: "http://px-metrics.px-metrics.svc.cluster.local/error-rate/{{args.namespace}}/{{args.service-name}}-{{args.canary-pod-hash}}"timeoutSeconds: 20jsonPath: "{$.error_rate}"
We need to measure HTTP error rate for the demo application. We can use Pixie to do this without changing Argo Rollout’s demo code since (since Pixie uses eBPF to automatically capture telemetry data without the need for manual instrumentation).
Pixie stores the collected metrics locally within your cluster, so we’ll create a metrics server that we can query via an endpoint. The metric server code can be found here and does the following:
- Exposes an
/error_rate/<namespace>/<pod>endpoint - When this endpoint is hit, it executes a hard-coded PxL script (Pixie’s query language) in order to compute HTTP error rate per pod(s).
- Returns the http error rate in a JSON object
Let’s put this all together and see an Argo Rollout in action. You can find detailed instructions for running the demo here. For brevity, we'll skip over the setup steps below.
The application we’re going to upgrade is an HTTP server which responds to requests with a color that indicates which version of the app it is. The front-end application displays colorful squares representing requests made by the browser to the backend application with the color determined by the response from the backend.
The Rollout template has set the application image to rollouts-demo:blue. The front-end displays blue squares indicating that the backend is responding with blue.
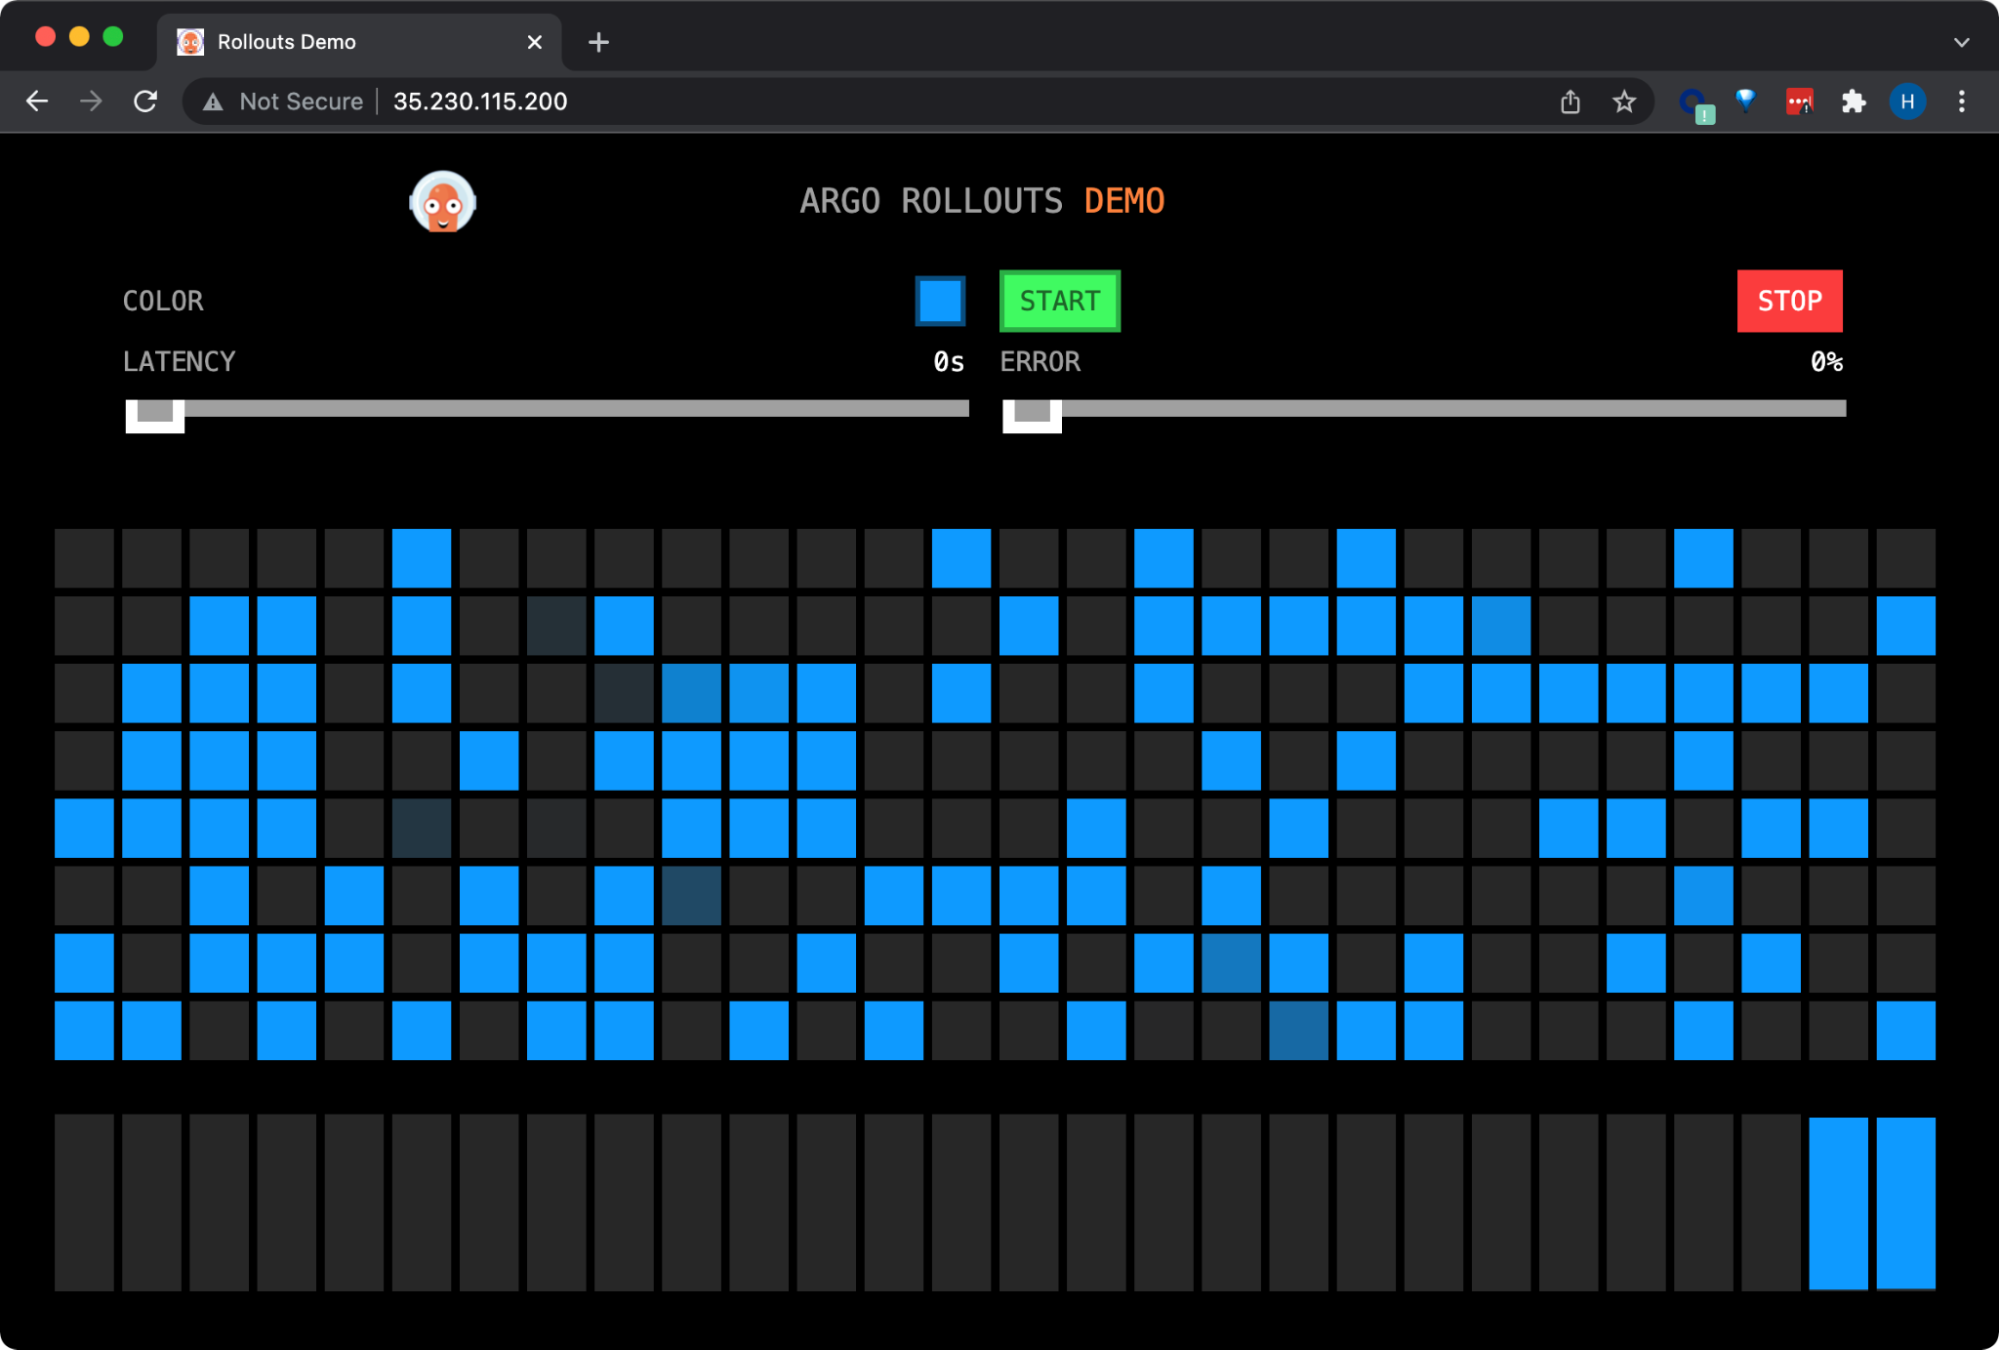
All requests made by the browser to the backend are served by the stable “blue” application image.
The bar chart at the bottom represents the percentage of requests that were handled by the different backends (stable, canary). Currently you should see all requests are handled by the stable blue backend version.
Let’s modify the Rollout’s application image to trigger an upgrade:
kubectl argo rollouts set image canary-demo "*=argoproj/rollouts-demo:yellow"
Some of the front-end traffic has now been directed from the blue (stable) version to the yellow (canary) version:
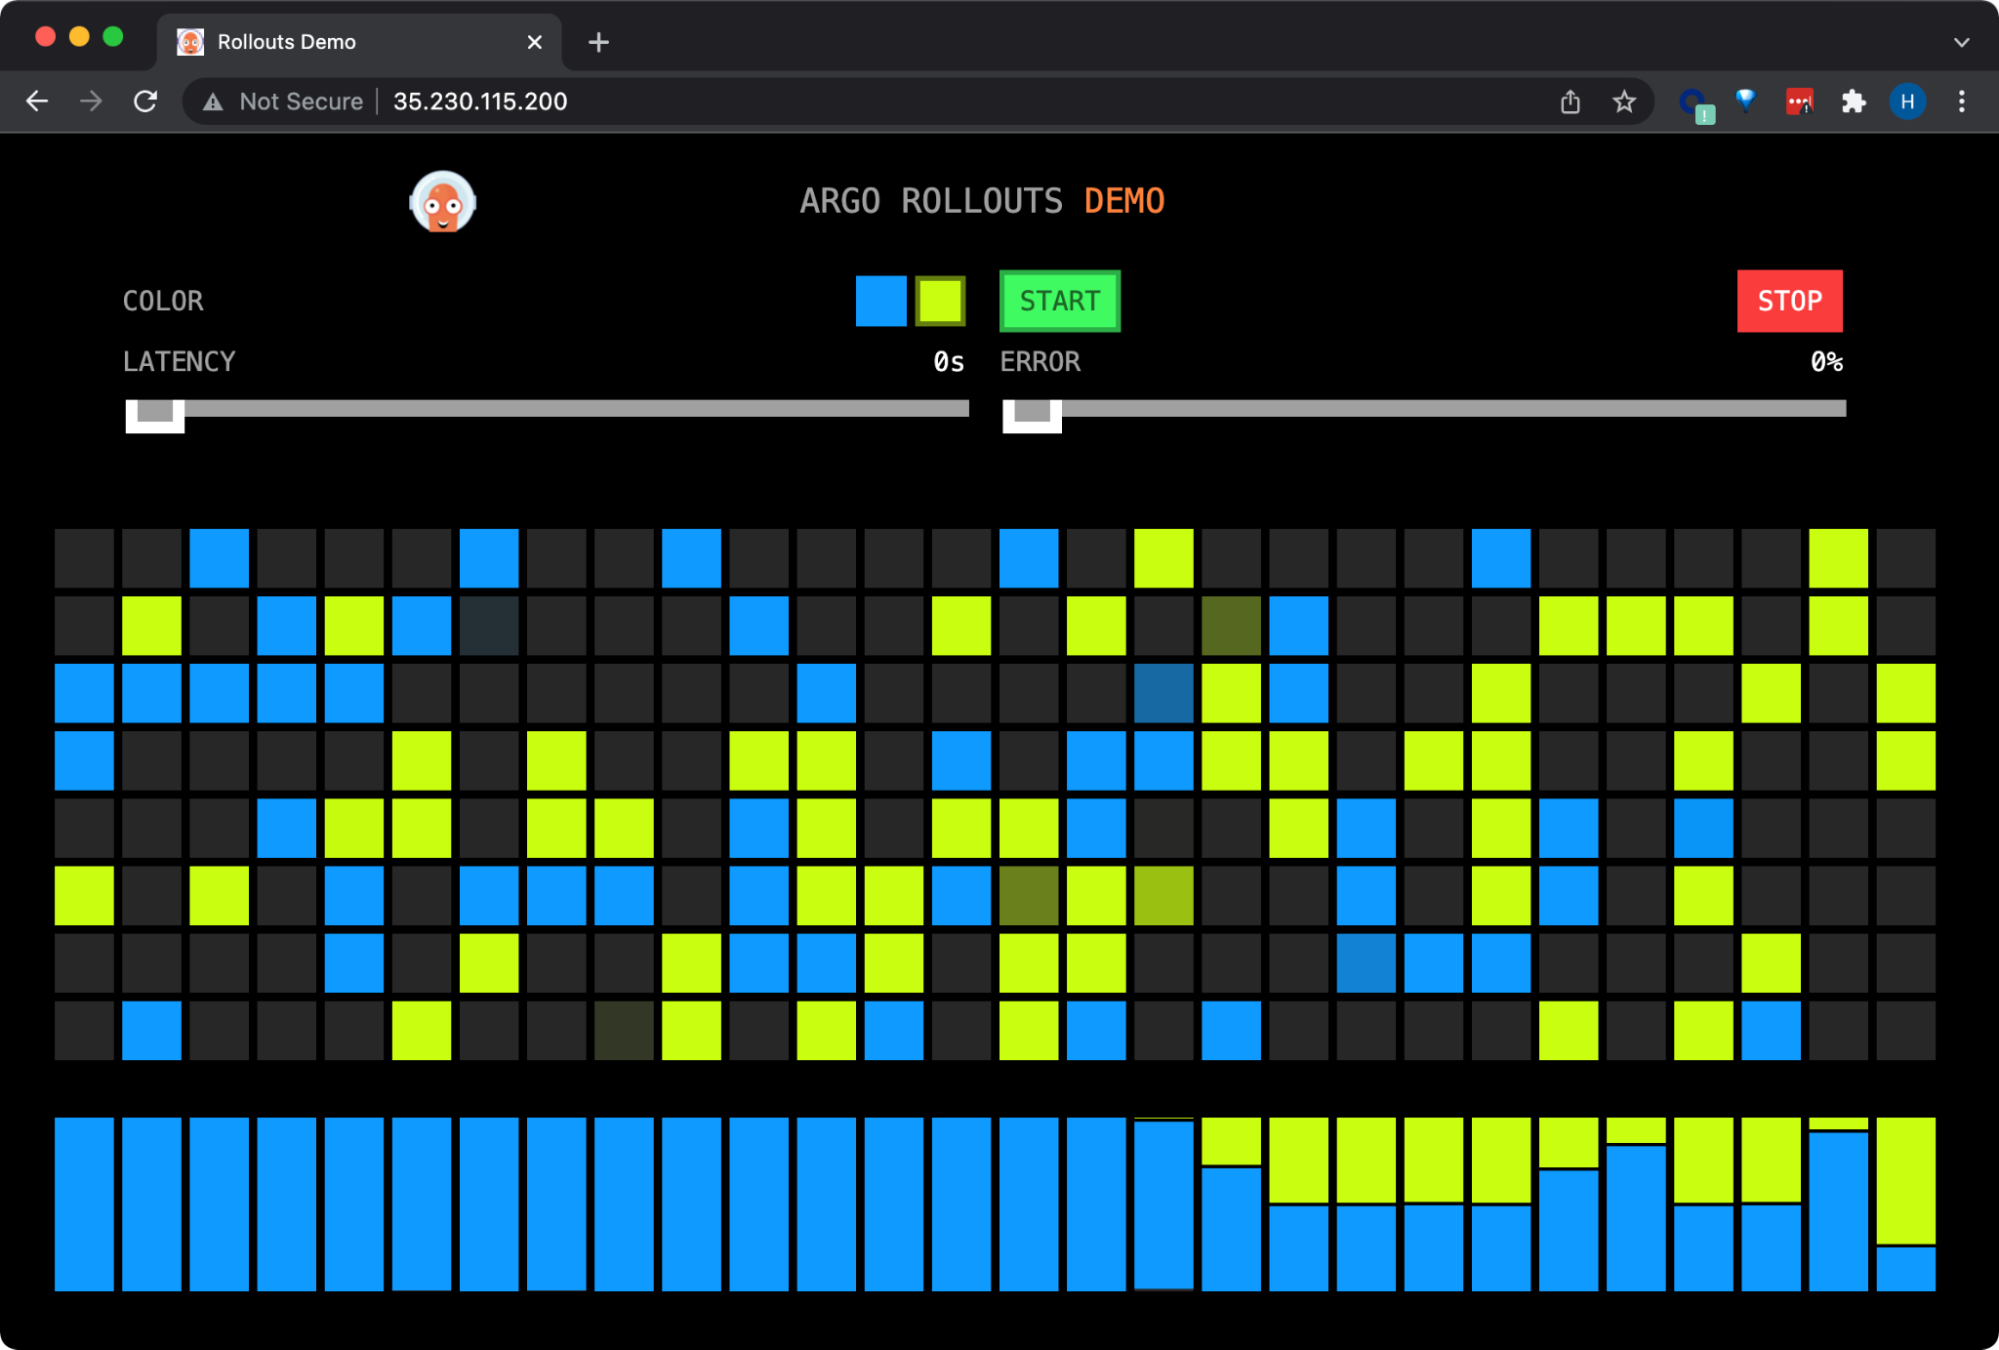
Argo Rollouts splits traffic between the blue (stable) version to the yellow (canary) version.
We can confirm the traffic split by watching the Rollout using the kubectl plugin:
kubectl argo rollouts get rollout canary-demo --watch
The first step of the canary analysis directs 50% of the traffic to the yellow canary release (setWeight:50):
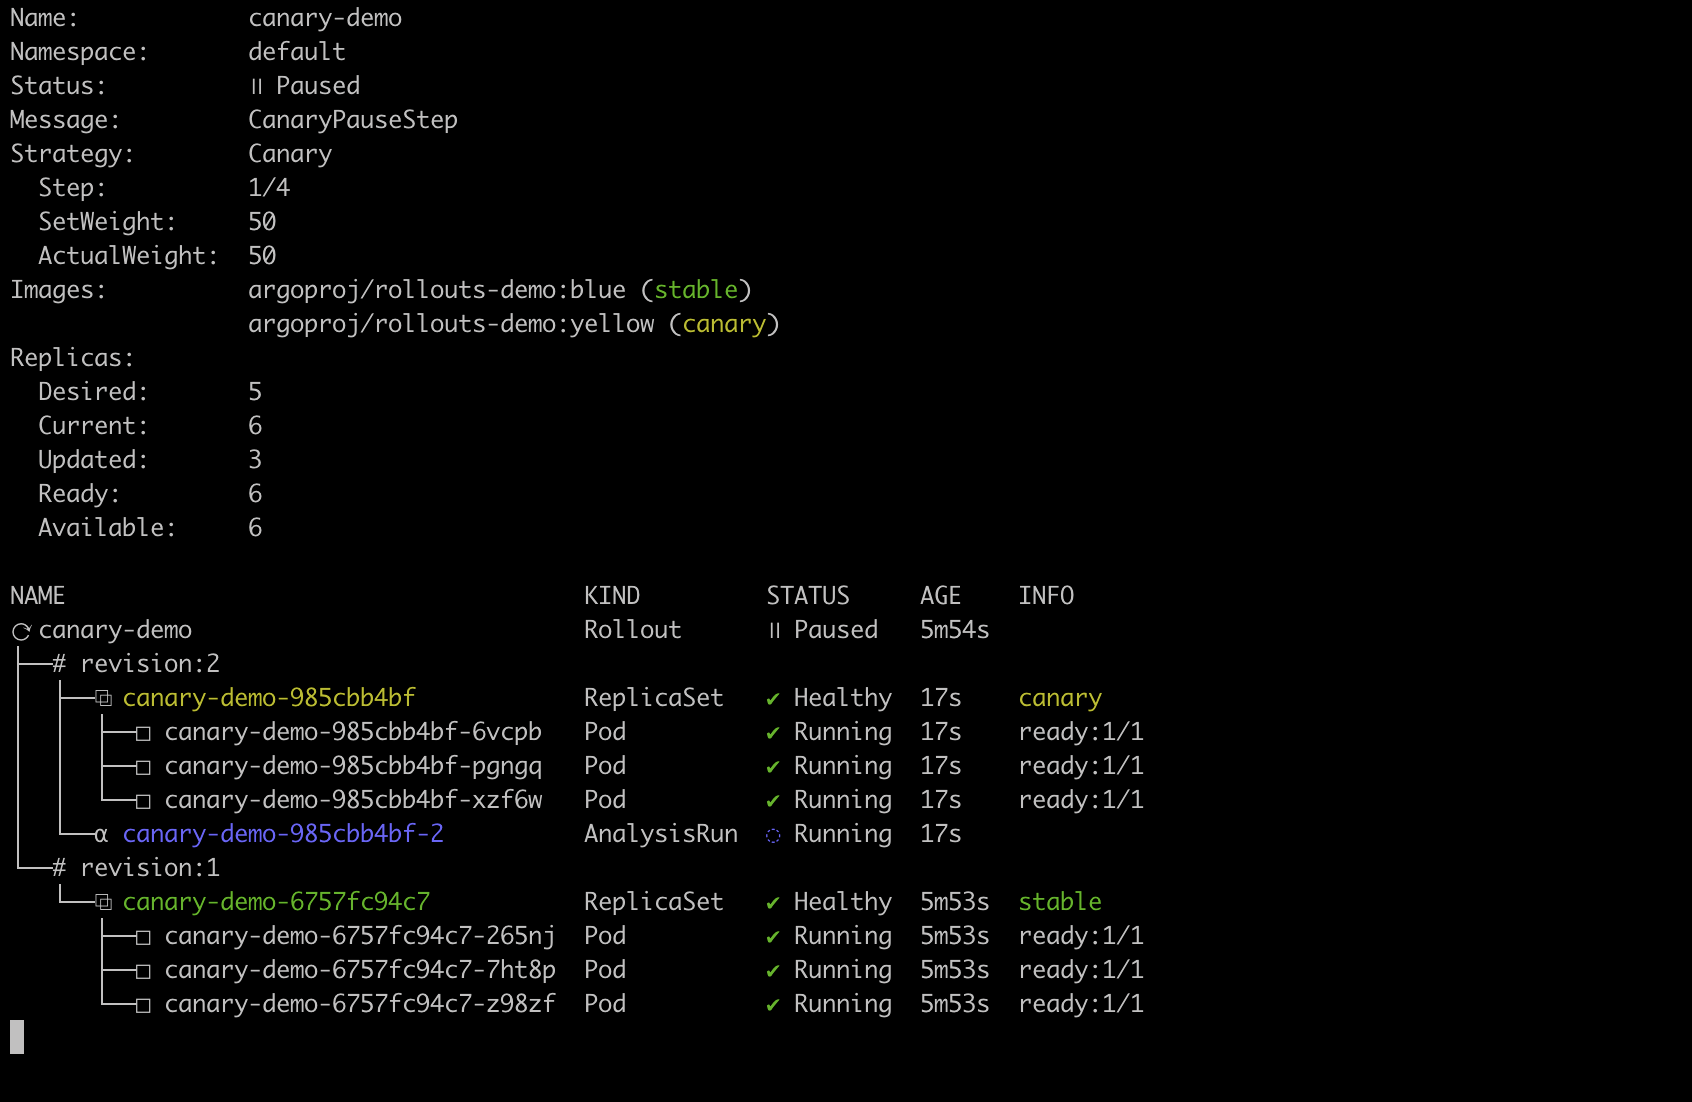
Watching the rollout in progress with the Argo Rollouts kubectl plugin.
Argo Rollouts splits traffic between the stable and canary version by creating a new replica set that uses the same service object. The service will split traffic across the stable and canary pods. In other words, controlling the number of pods controls the traffic percentage.
Every 30 seconds, the rollout controller queries the Pixie metric server to get HTTP error rate for the canary pods. Pixie does not report any errors for the yellow (canary) pods throughout the rollout, so the controller rolls forwards the release and promotes the yellow image to the stable image:
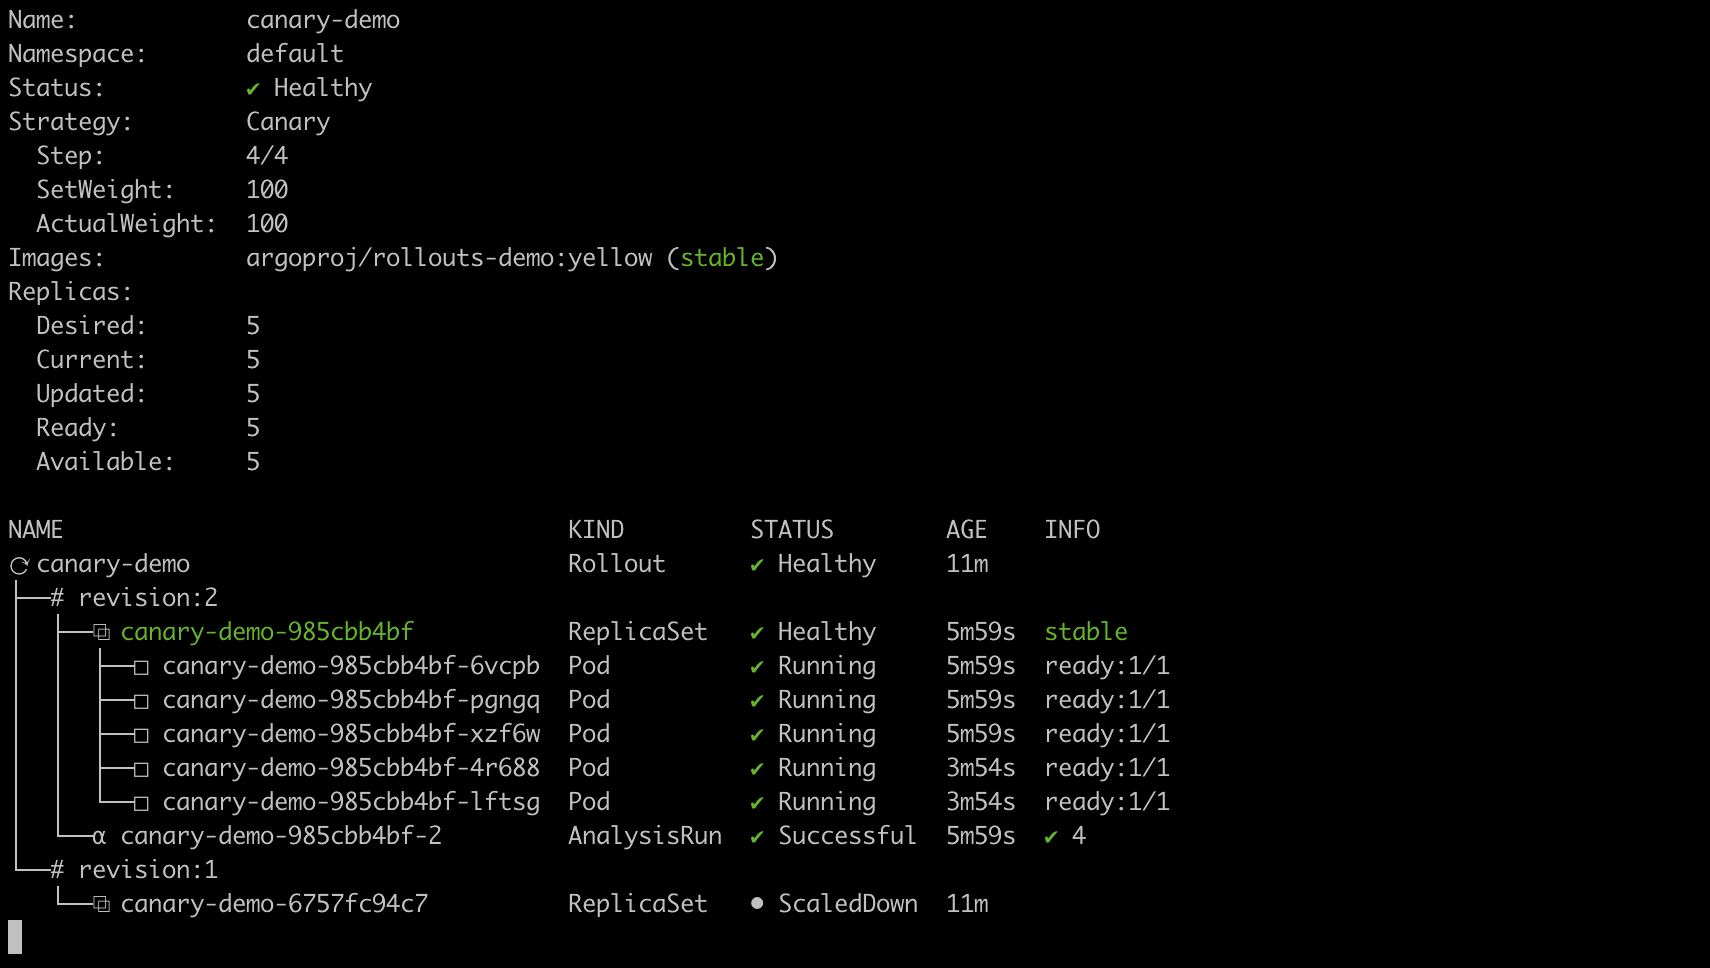
The rollout has succeeded and the yellow image is promoted to stable.
Let's again modify the image tag of the application Rollout to trigger an upgrade. This time we'll update it to a buggy application image (bad-red) which returns 500 errors for most requests:
kubectl argo rollouts set image canary-demo "*=argoproj/rollouts-demo:bad-red"
Some of the front-end traffic has now been directed from the yellow (stable) version to the bad-red (canary) version:
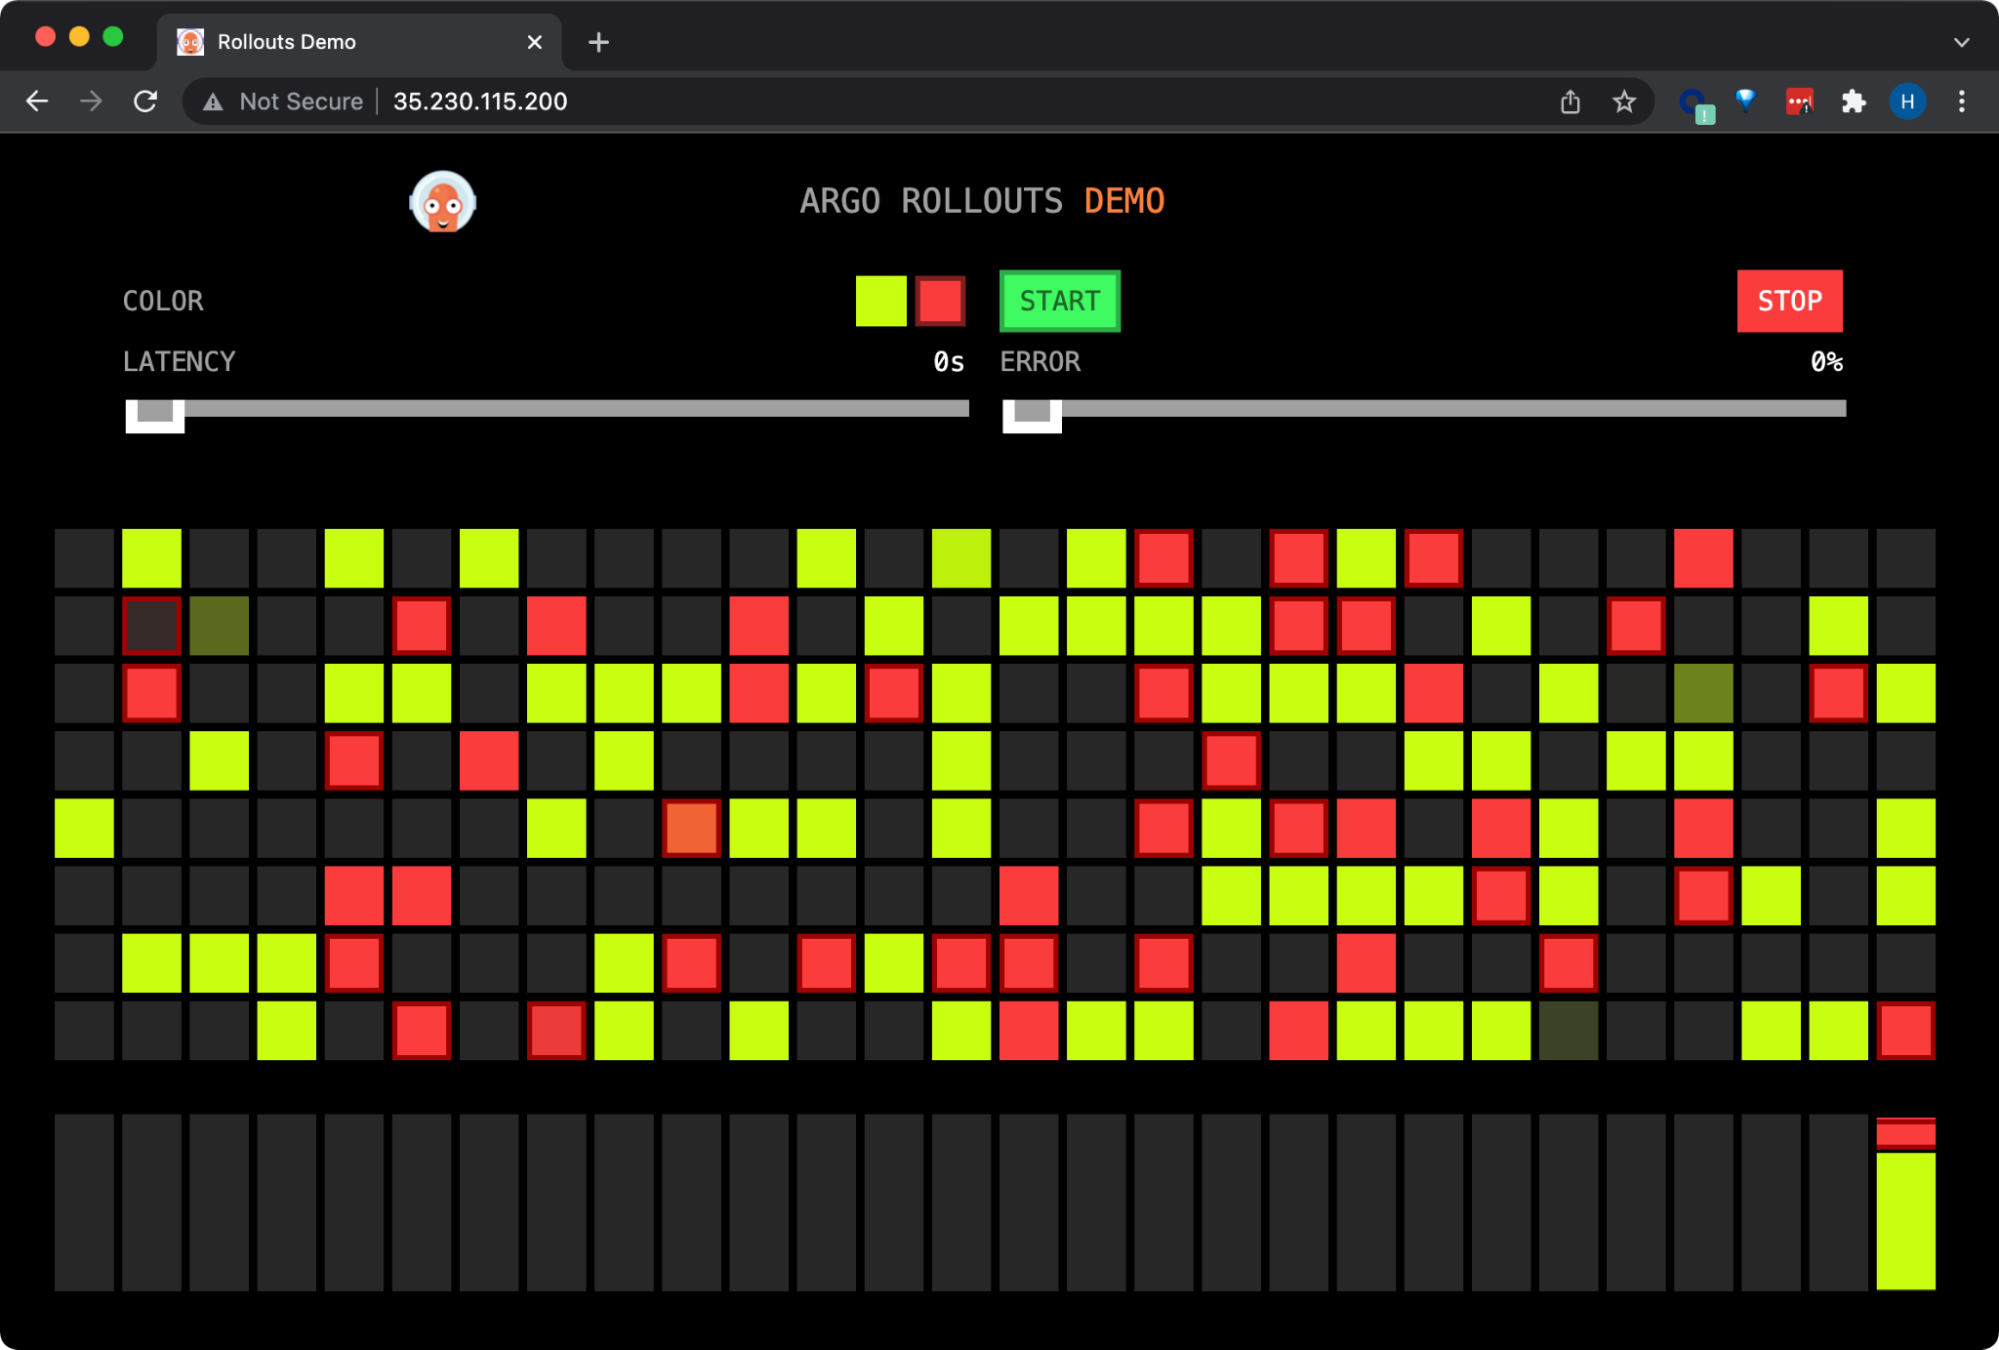
Argo Rollouts splits traffic between the yellow (stable) version to the red (canary) version.
As with the last release, the Rollout controller queries the Pixie metric server to get HTTP error rate for the canary pods every 30 seconds. After the initial delay of 30s (set in the AnalysisTemplate), the first metrics return an HTTP error rate that does not meet the successCondition defined in the same AnalysisTemplate.
The rollout fails and the Rollout controller automatically rolls the deployment back to the yellow (stable) version:
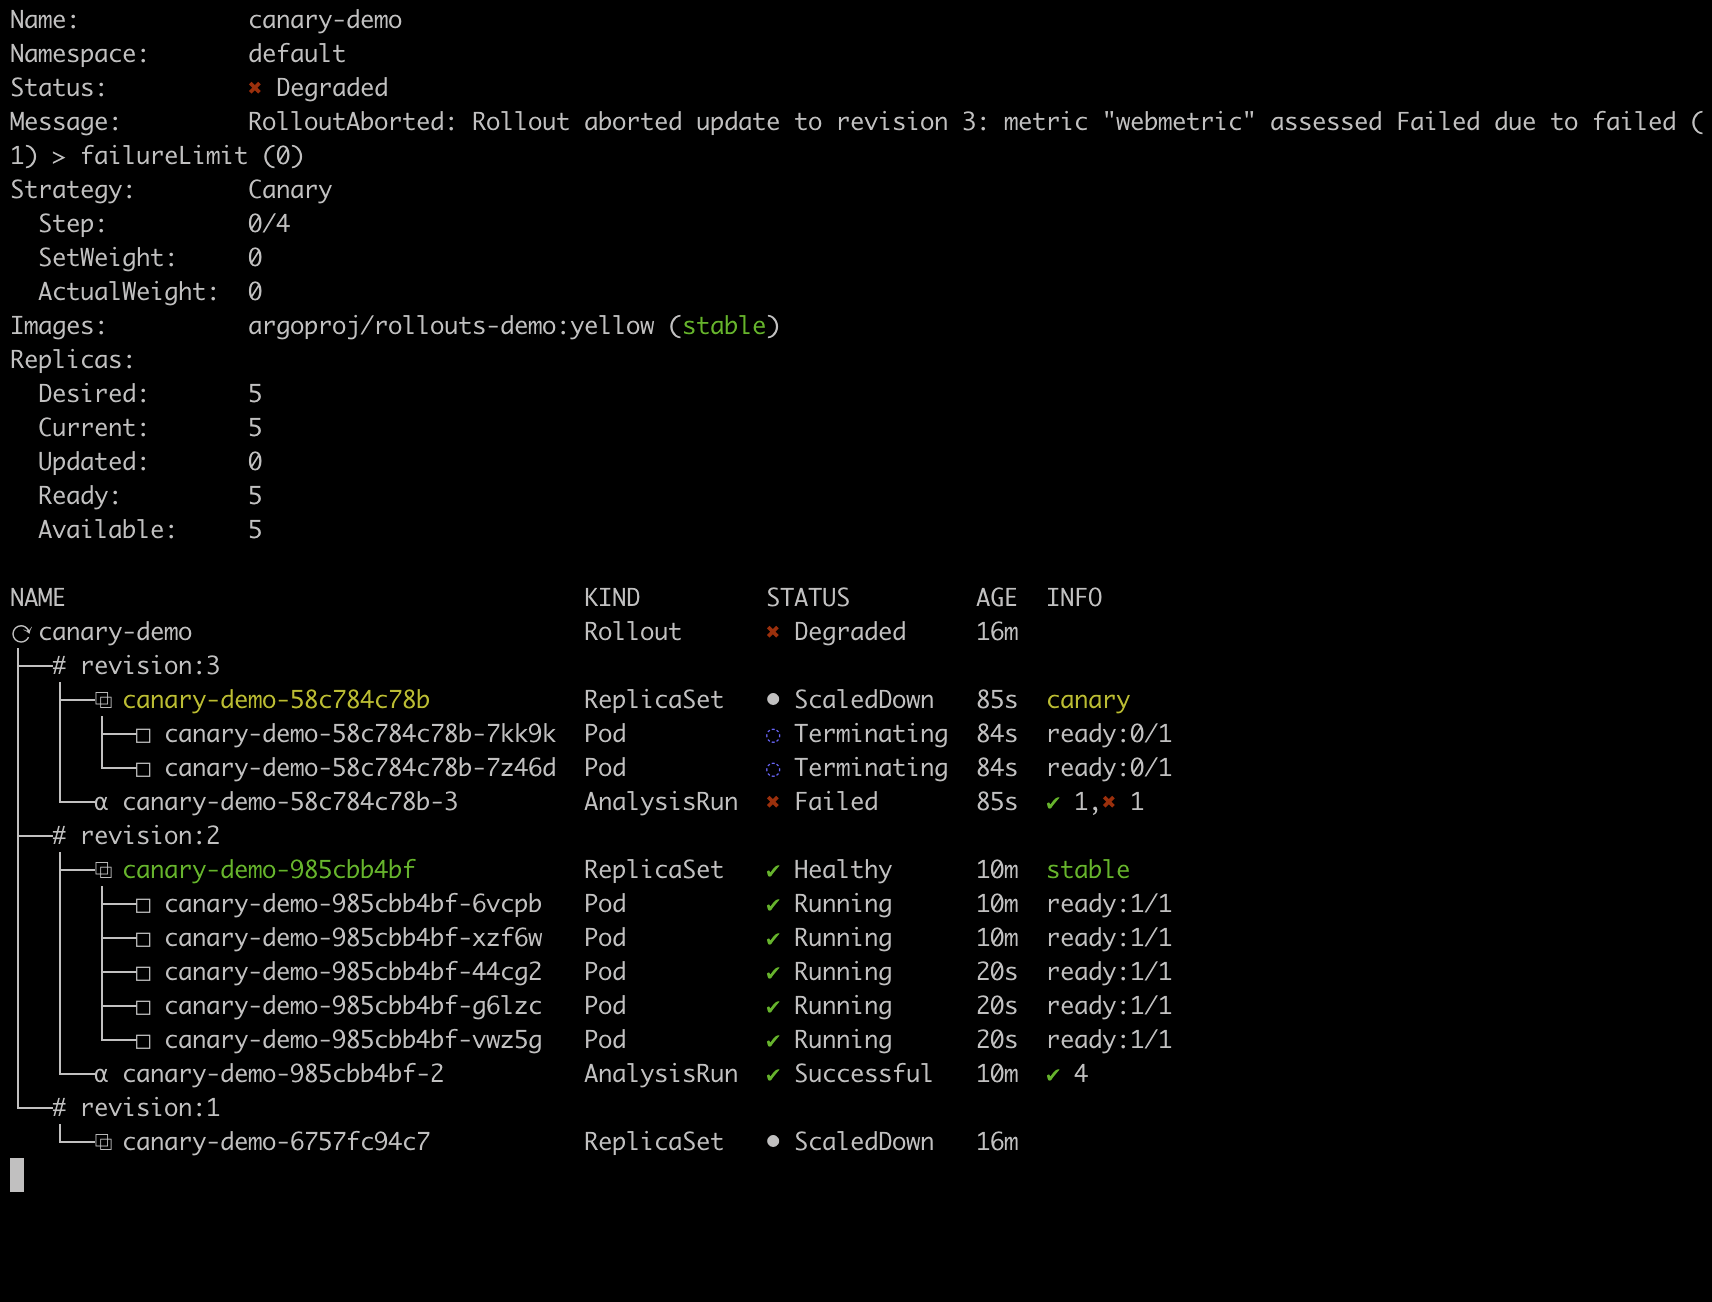
The rollout is aborted due to the failed canary analysis.
We can inspect the analysis results by looking at the AnalysisRun. Here we see that the canary pods HTTP error rate of 82% is well above the criteria we defined for a successful release in the AnalysisTemplate.
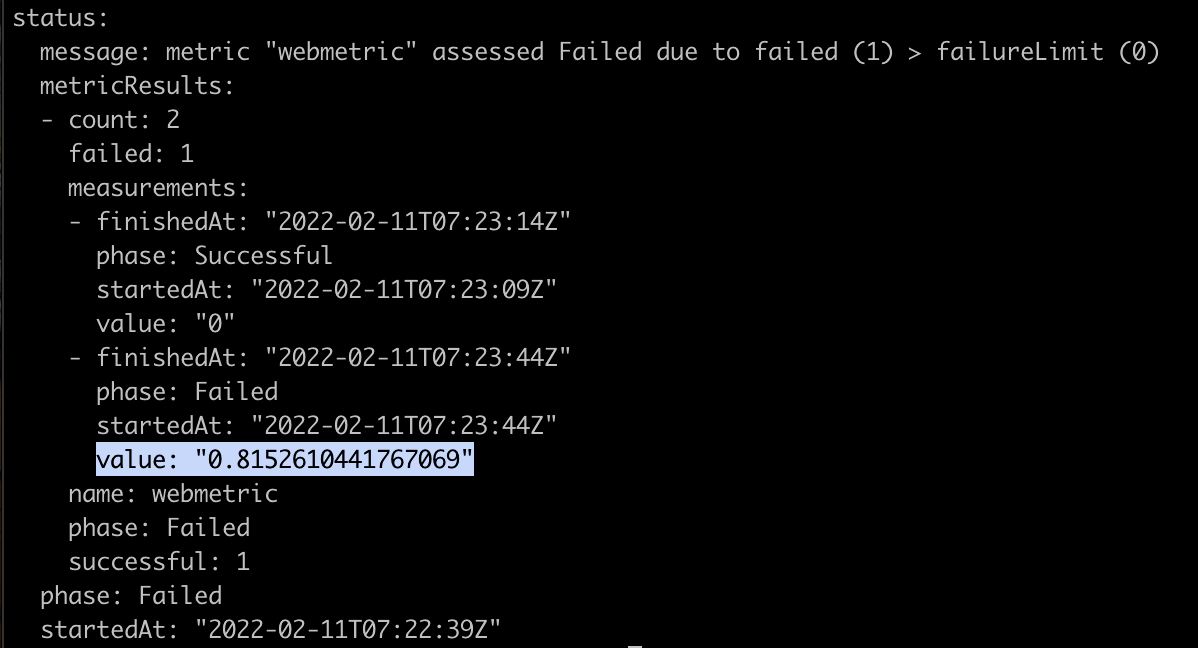
The rollout is aborted due to the failed canary analysis.
You can find the source code and instructions for running the demo here.
To change the behavior of the Rollout, such as increasing the number of steps, pause duration, or traffic weight, take a look at the available fields and descriptions in Argo’s Rollout Specification.
We used HTTP error rate to analyze the performance of the canary deployment, but the Pixie metrics server could be modified to generate pod latency or throughput. Pixie also supports other request protocols.
Terms of Service|Privacy Policy
We are a Cloud Native Computing Foundation sandbox project.
Pixie was originally created and contributed by New Relic, Inc.
Copyright © 2018 - The Pixie Authors. All Rights Reserved. | Content distributed under CC BY 4.0.
The Linux Foundation has registered trademarks and uses trademarks. For a list of trademarks of The Linux Foundation, please see our Trademark Usage Page.
Pixie was originally created and contributed by New Relic, Inc.


